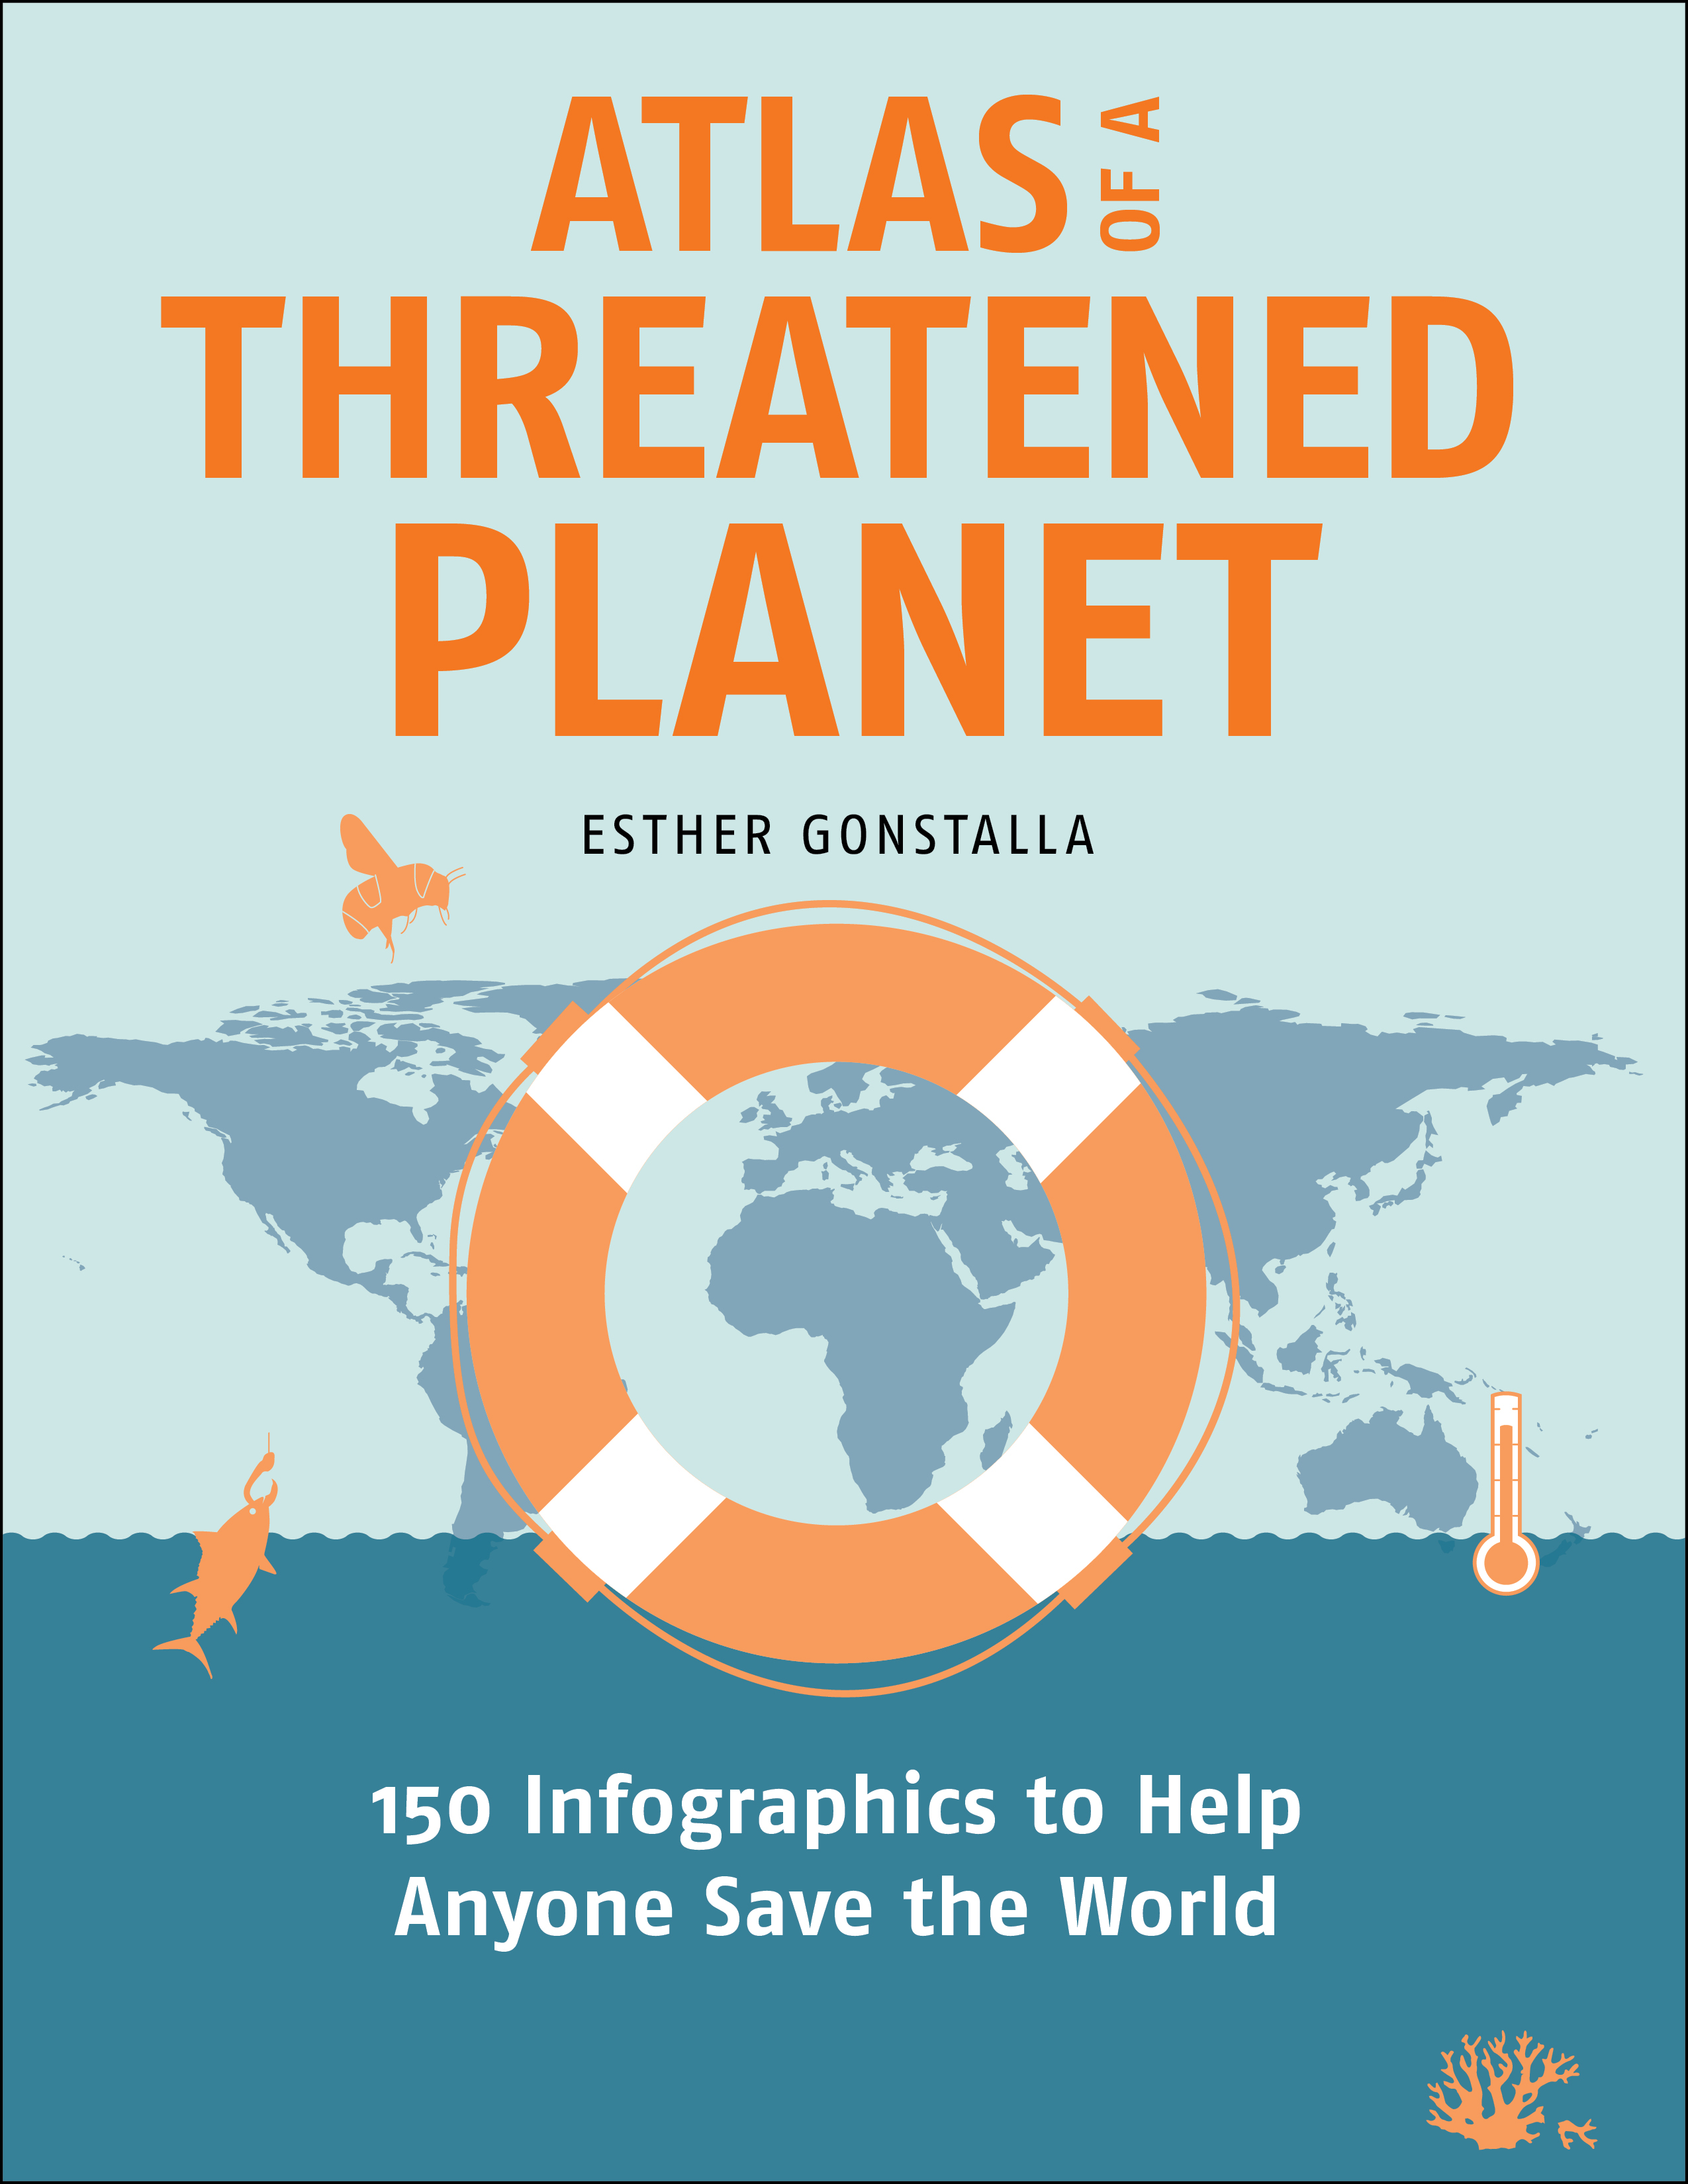
Book Description
Our planet is a fascinating and complex place, but the challenges we face can seem overwhelming. How does our climate actually work? Should we worry about the global supply of drinking water? How much land do we need to grow food? And can technology help reverse the damage we’ve done?
In Atlas of a Threatened Planet, award-winning book and graphic designer Esther Gonstalla digs into these questions and many more through her attractive and easy-to-understand infographics. Gonstalla is known for breaking complex topics into digestible and memorable pieces in her popular “Our World in 50 Graphics” book series. In this book, she turns her designer’s eye to the most critical threats to our environment, from shrinking glaciers and declining biodiversity to shifting ocean currents. These accessible and fun illustrations will show readers that, although the threats are grave, not all is lost. Changes in technology, infrastructure, and our outlook can still help us protect the places we love.
Atlas of a Threatened Planet will spark your curiosity and invite you to see the Earth in a new way. It is written for all who want to understand the interlocking pieces of our home—and fight for the best ideas and strategies to save it.
Summary of Contents
The Spheres of the Earth
The Atmosphere: Air, Weather & Climate
The Hydrosphere: Water, Ice & Snow
The Biosphere: Soil, Plants & Animals
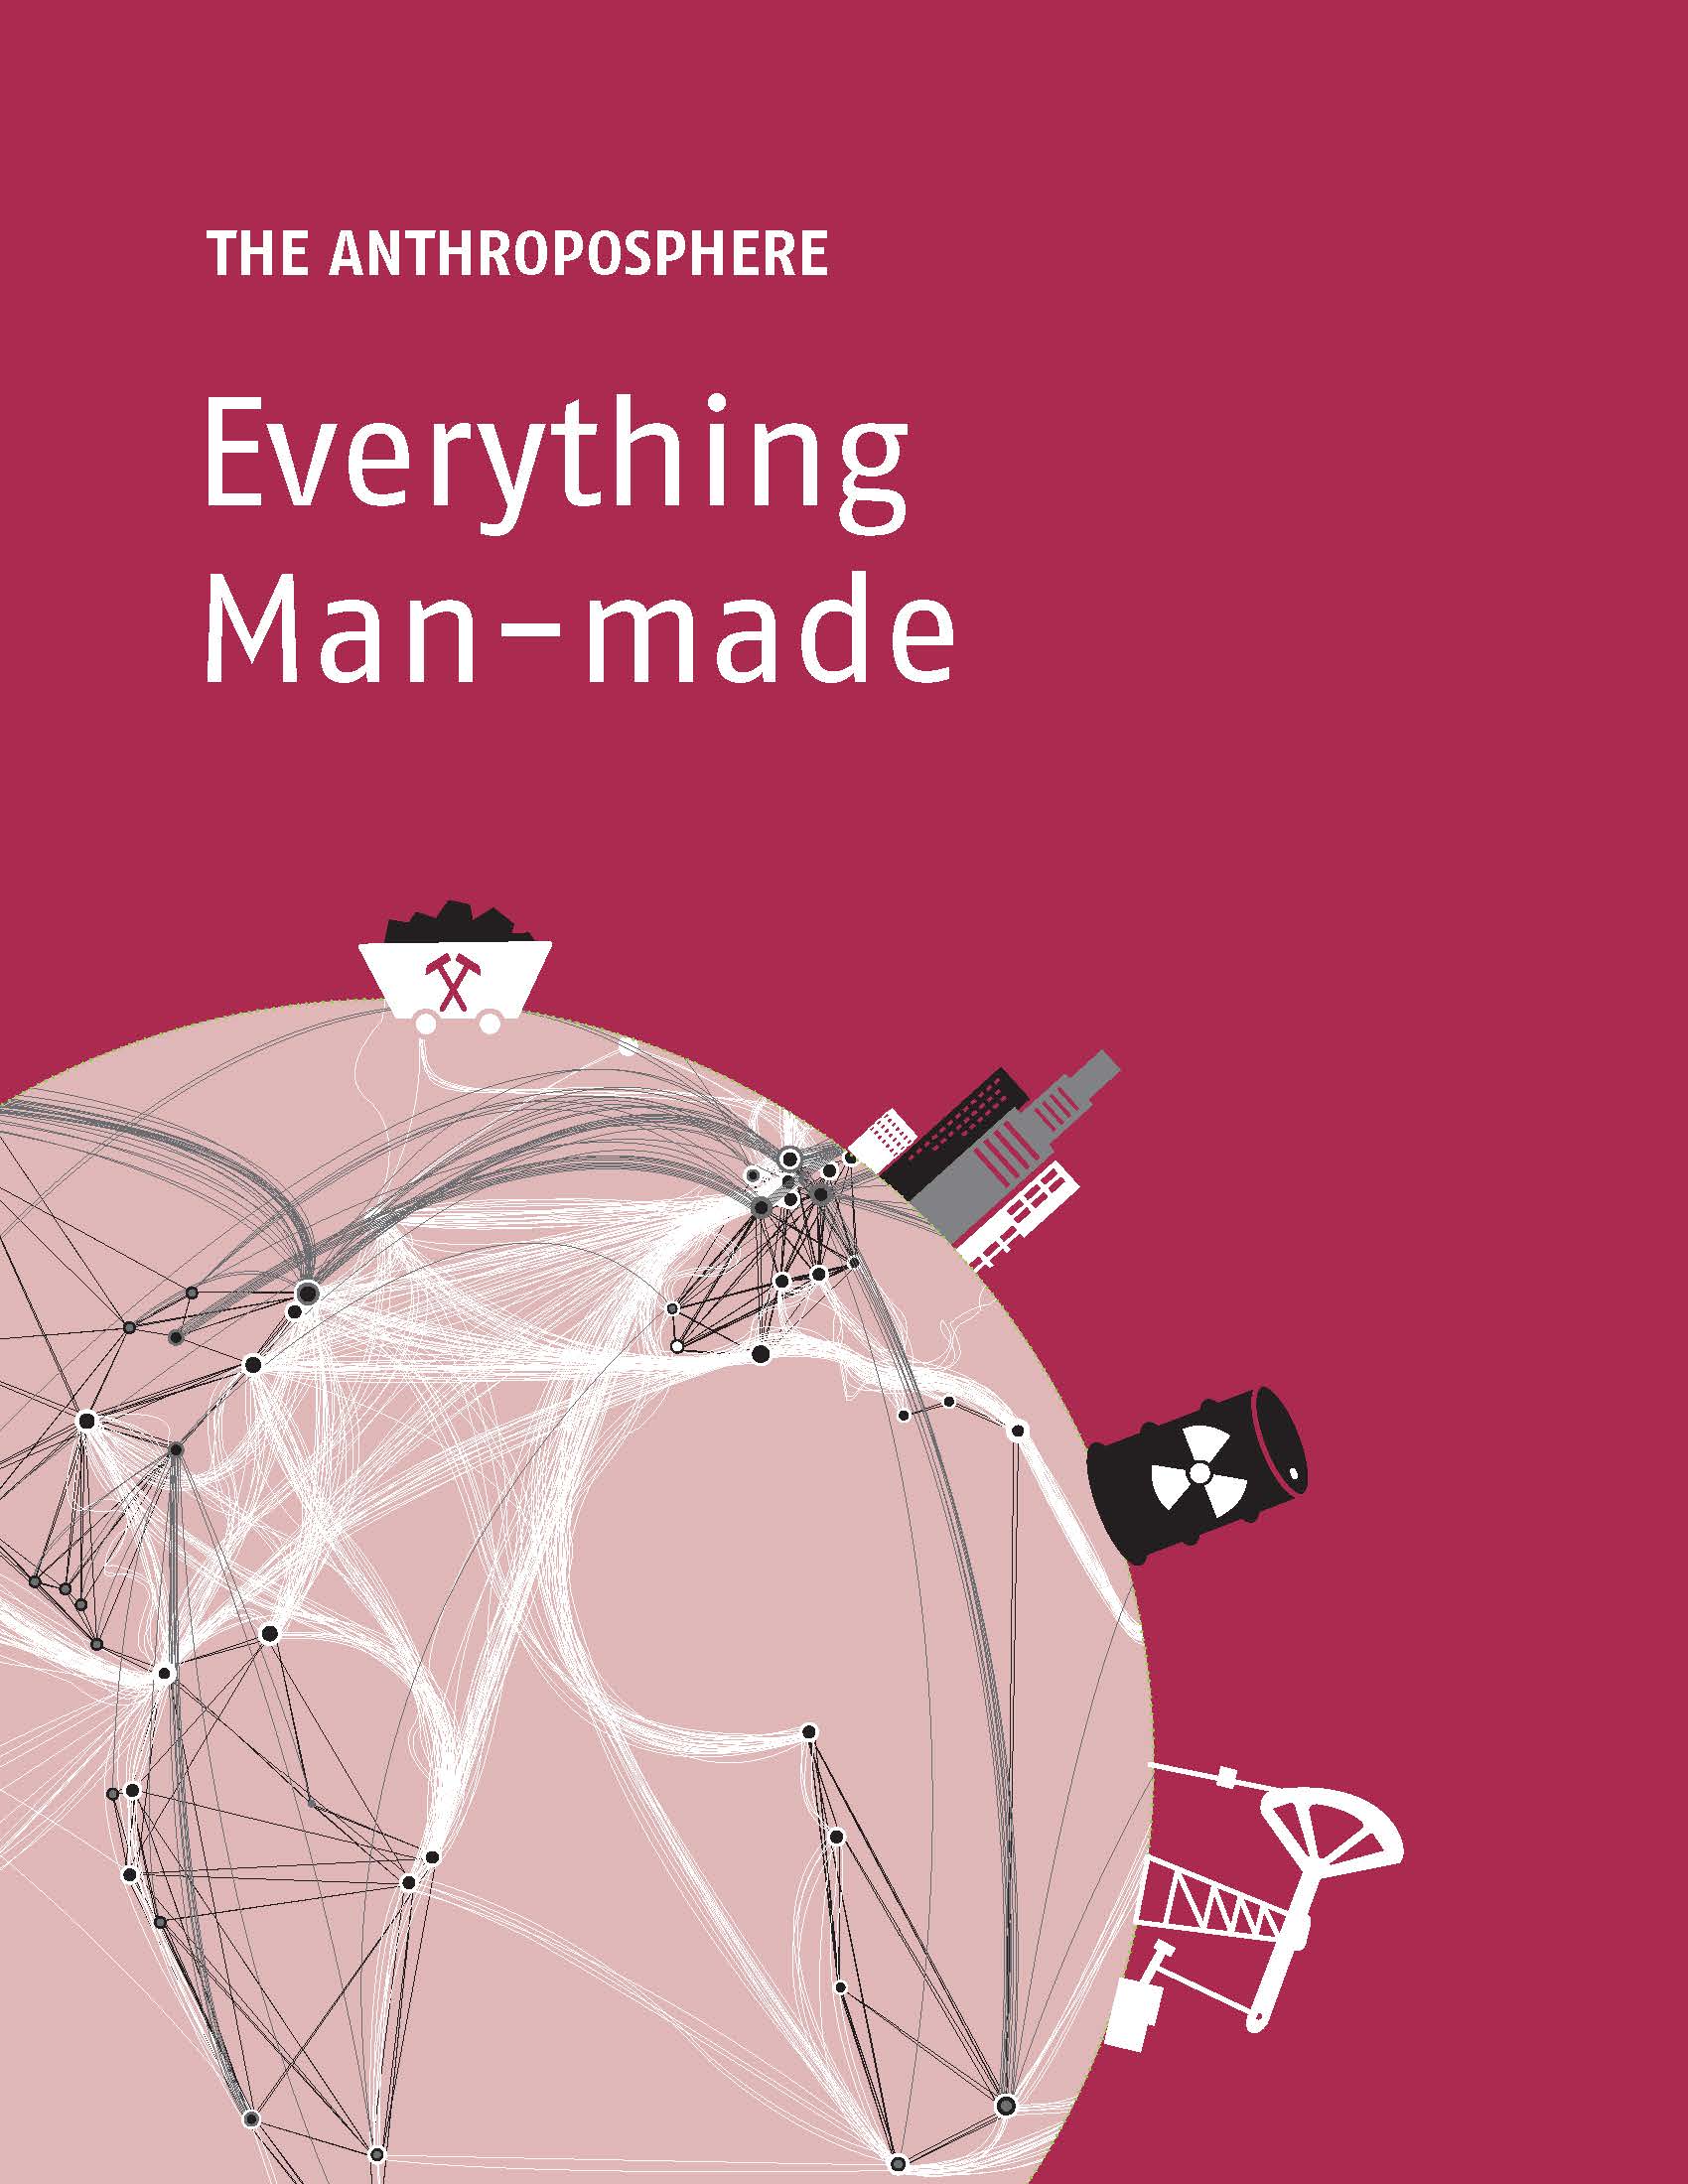
The Anthroposphere: Everything Man-made
References
About the Author and Thanks
The Spheres of the Earth
The Earth ecosystem that is our home is shown to be composed of four spheres: the atmosphere, the hydrosphere, the biosphere, and the anthroposphere.
Atmosphere ~ The protective layer that surrounds our planet. This includes:
Oxygen ~ Animals and humans need oxygen to survive.
Earth's climate ~ Our climate is controlled by the composition of the atmosphere and is dependent on water vapor content and greenhouse gases.
Weather ~ Rain, sunshine, clouds, storms: the weather in the atmosphere is constantly changing.
Hydrosphere ~ Life-giving water in all its forms. This includes:
Saltwater ~ The salty oceans make up the majority of our water.
Freshwater ~ From groundwater to springs, rivers, and lakes to our taps.
Frozen water ~ Ice, glaciers, snow, frozen soil, and bodies of water.
Water cycle ~ Water is constantly exchanged between land and atmosphere.
Biosphere ~ All animals and plants on, above, and below the ground. This includes:
Ecosystems ~ Plants and animals live in complex interconnected habitats.
Animals ~ From tiny sea creatures to the largest mammals on land and migratory birds in the air, every animal has its niche.
Plants ~ From grasses, cacti, and trees to algae and kelp forests underwater, plants are as diverse as their habitats.
Anthroposphere ~ Everything man-made and constructed. This includes:
Industry ~ Production of goods, energy, and waste.
Agriculture ~ Livestock farming and cultivation of fruit, vegetables, and energy crops.
Infrastructure ~ Roads, train tracks, airports, and sea ports for global transport.
Settlements ~ From villages to megacities.
Raw Materials ~ Production of raw materials such as mining for coal, iron, or rare earth metals, oil production, or clearcutting
for timber.
The Atmosphere: Air, Weather & Climate
The atmosphere is the gaseous envelope of the Earth, inside which wind, clouds and precipitation form. It filters, absorbs.
and reflects the sun's radiation, making life on Earth possible. Without an atmosphere, our planet would resemble a snowball.
This section provides infographics of the water cycle of the Earth, air in motion, air currents at the poles, extreme storms, the natural greenhouse effect, how we are changing the climate, anthropogenic greenhouse gases, complex carbon cycles, world population growth and CO2 levels, the top 10 countries producing CO2 emissions, the planetary energy balance, how the Earth is warming up, the distribution of heat, the geographic distribution of climate tipping points, effects of the climate crisis, extreme weather events, future climate thresholds, prospective climate solutions, tools to minimize climate risks, global energy decarbonization, solar and wind power, electricity generation from solar and wind, transition to green transport, options for
|

|
Click the images to enlarge
|
binding CO2, adaptation to climate change, mitigation of climate impacts, and the pros and cons of climate geoengineering.
Editor's comment:
A significant feature of many of the infographics is that they show the feedback loops known to be operative in natural and anthropogenic climate change.
The Hydrosphere: Water, Ice & Snow
All the water on Earth together forms the hydrosphere, regardless of its state: liquid in water bodies, and oceans, gaseous in the air and in clouds, or frozen in sea ice and snow.
This section provides infographics of the seas of the Earth, the closed-loop interactions between humans and the oceans, the oceans and climate change, garbage in the seas (huge amount os plastic floating around!), rivers and dams, hidden freshwater, wetlands, the world of ice (cryosphere), forms and movements of ice, sea and land ice, Nort Pole vs. South Pole, how ice is essential for the climate and living creatures, how humans are dependent on ice, data on the Earth's ice masses, melting ice and rising water levels, the water crisis (less water and more people), life-saving melt water, how glaciers decrease due to warming climate, direct and indirect water consumption, rivers of waste, polluted groundwater, and priorities in the global water crisis.
Editor's comment: The infographics in this section show that everything is connected with water, and the health of the biosphere (next section) as well as human survival, are utterly contingent on clean water supply.
The Biosphere: Soil, Plants & Animals
The biosphere is the living part of the Earth: plants, animals, and humans. It includes all habitats from forests, steppes, deserts, and ice to soils, oceans, and the lowest layer of air.
This section provides infographics of underground ecosystems, communication in the soil (the symbiosis between organisms and vegetation), how soils can store or release carbon, the value of grasslands, permafrost (frozen soils), life's building blocks, the diversity of plants, the life of a tree, the forests of the Earth, hotspots of biodiversity, underwater forests, why our climate depends on healthy forests, the breaths of the forests (lungs of the Earth!), the great green wall in Africa, what happens when the climate becomes drier, halting species loss and stabilizing the climate, animals and global fauna, complex food webs (trophic levels), loss of forest dwellers, the underestimation of insects, icy habitats, rise of invasive species, marine animals, effects of overfishing and bycatch (red lists), oversized fishing fleets, why the need to top overfishing, the future of fish farming, noise in the oceans, and marine protection areas.
Editor's comment: The infographics in this section set the stage for showing, in the next section, why a healthy biosphere is absolutely essential for the viability of human life and the sustainability of the human enterprise.
The Anthroposphere: Everything Man-made
The anthroposphere includes everything that has been created, modified, or degraded by humans. This includes changes to the Earth's surface for agriculture, transport, industry, or buildings, as well as chemical changes to the air, water, and soil.
This section provides infographics of industrial ecology, including global raw material extraction, deep sea mining, oil spills, raw materials for electricity generation and other energy needs, radioactive raw materials, trees as 'green' energy sources, the future of 'green' energy, sustainable forestry, trends in wood production, sand mining for concrete and other uses, the worldwide ubiquity of plastic, recycling of raw materials, the global transportation of goods, sea transport (huge merchant fleets), land transportation routes and road construction, how infrastructure drives deforestation with serious consequences for animas and the environment (a magnificent infographic!), green cities and urban forests, agriculture and how we feed the world (small farms, agribusiness), the impending transition in agricultural practices, agroforestry and sustainable farming, how to reduce our ecological footprint, consuming sustainably, and protecting nature.
Editor's comment: In terms of human ecology, the infographics in this section show that the Anthroposphere is where the rubber meets the road. Our modern techno-industrial civilization, while undoubtedly inducing historically significant economic growth and material comfort (for those who can afford it in a growing population) is also degrading the human habitat in ways that may be irreversible and eventually compromise the survival of the human species.
References
For each of the 150 infographics, references (many of them with web links) are provided at the end of the book.
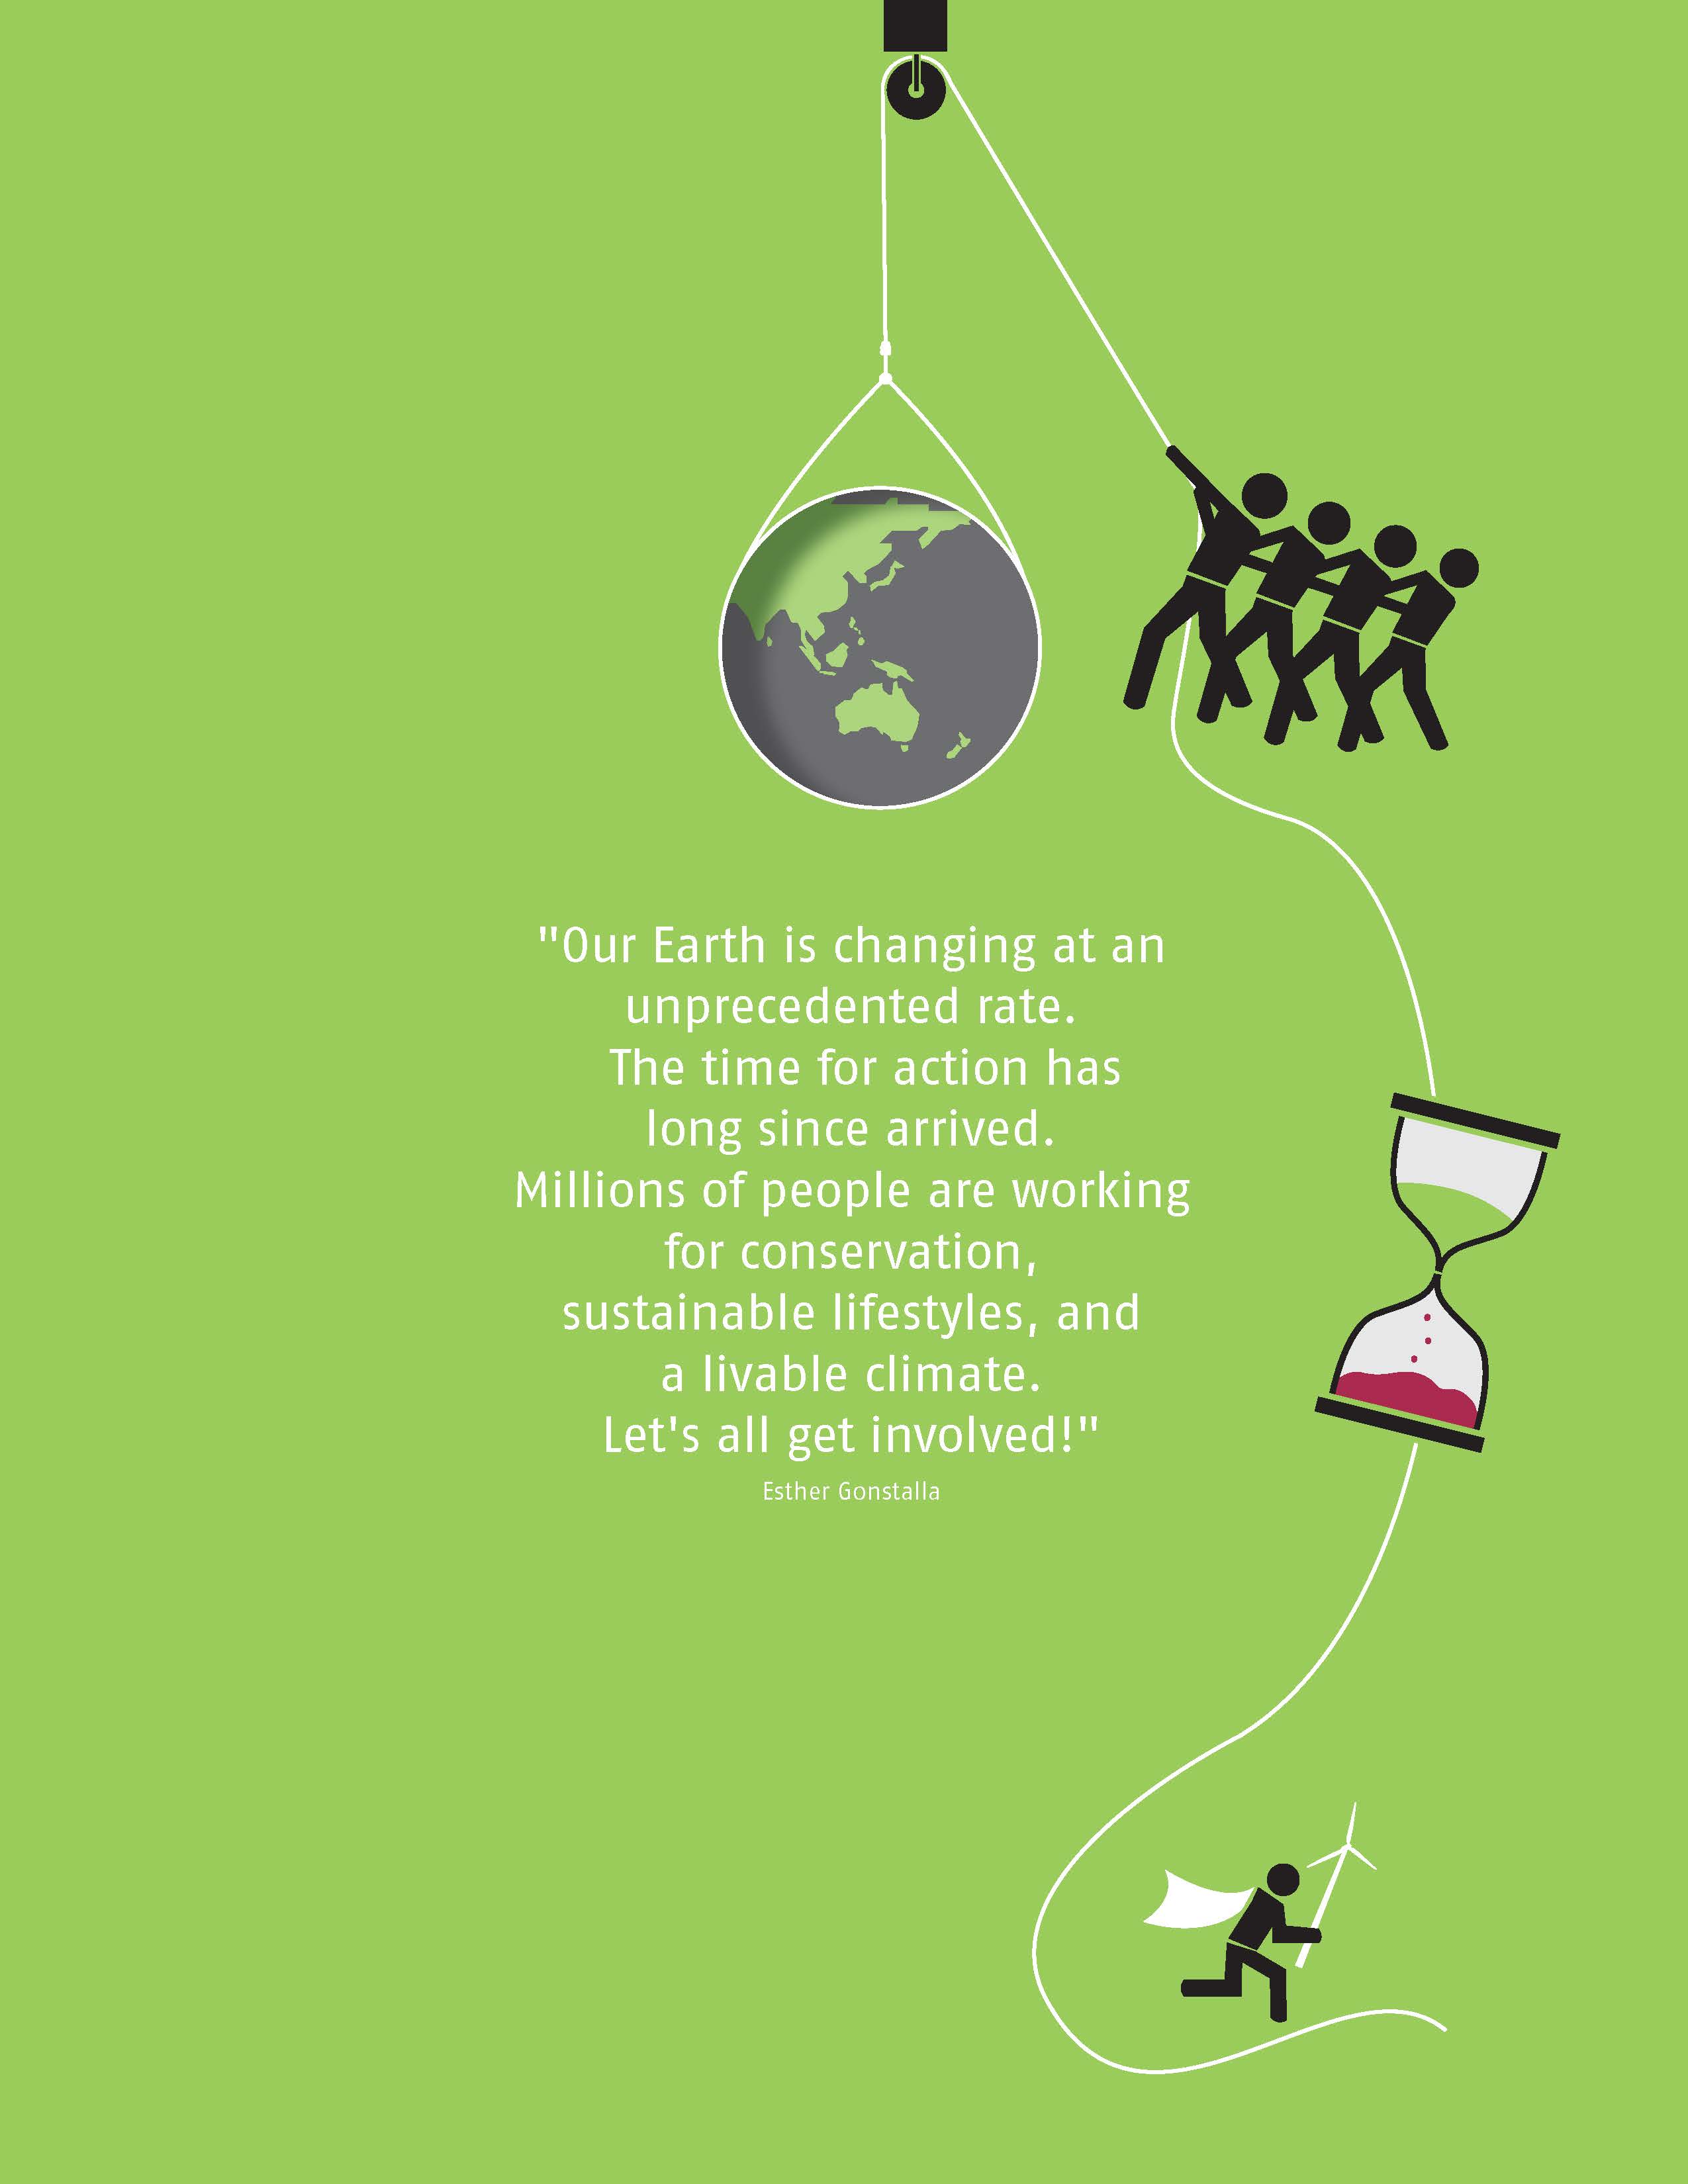
Author's note: "Our Earth is changing at an unprecedented rate. The time for action has long since arrived. Millions of people are working for conservation, sustainable lifestyles, and a livable climate. Let's all get involved!" Esther Gonstalla
Editor's comment: This compilation of infographics is a jewel for anyone who wants to understand how everything is connected in our planetary ecosystem. The legends are brief and to the point. With regard to renewable ('green') energy resources, the book may be a bit too optimistic, because diesel fuel is required to build the infrastructure and the equipment (e.g., solar panels, wind mills). As long as global population and the global economy keep growing, and global energy usage keeps growing, 'green' energy may be adding to the energy supply but not completely replacing fossil fuels. This is a vexing issue for which no solution has thus far been formulated. But this book nevertheless provides excellent visualizations of the interconnections between all the relevant biophysical factors, and between human behavior and the human habitat.
|
ABOUT THE AUTHOR
Esther Gonstalla is an award-winning book and infographic designer. She is the author of the “Our World in 50 Graphics” series and has worked for global NGOs such as Bread for the World, Friends of the Earth Germany, More Democracy, and Fair Oceans. In her books and design projects, Gonstalla translates often-complex scientific reports and statistics into modern and accessible illustrations. From mangrove forests to the Alps and the North Pole, her work introduces readers to fascinating ecosystems and their inhabitants, explains why these places are threatened, and shares ideas for saving them.
|