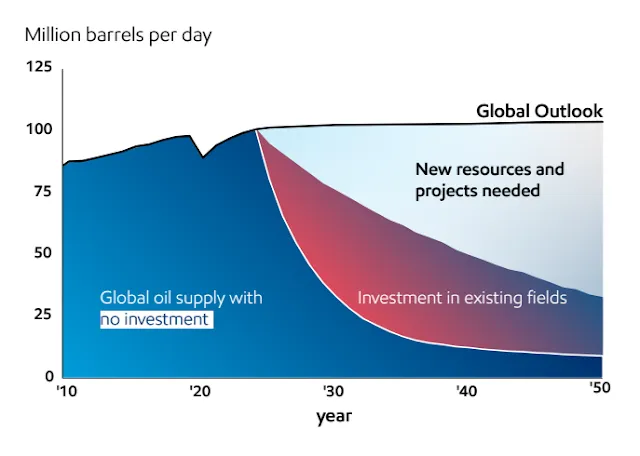
An old prediction of mine is coming true. From Exxon's mouth.
First of all, let me show you a picture of myself from a meeting in 2017 in Vienna. I was showing a graph very similar to the one the Exxon report shows now, seven years later:
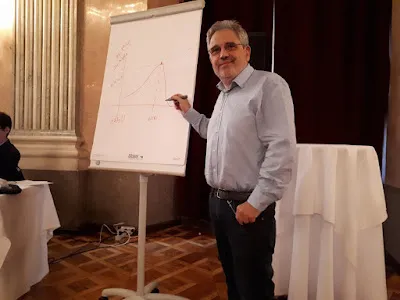
Click on the image to enlarge.
As a prophet, I think I did reasonably well, at least in qualitative terms. If you read the whole post about that meeting, you’ll see that I described the plight that the latest Exxon Report would describe seven years later. “Either you give us more money, or we’ll fall down the Seneca Cliff!”
This situation is caused by the basic mechanisms of our economic system: how we exploit resources, trying to obtain the maximum profit from them. When dealing with mineral resources, system dynamics provides good models to describe the economic cycle that ends when the resource is depleted to the point that extraction is no longer profitable.
A simple system dynamics extraction model is known as the “Hubbert Model.” It is often applied to oil production and says it should follow a “bell-shaped” curve: grow, peak, and then decline. Here, the curve is shown with fat cows during growth and lean cows during decline.
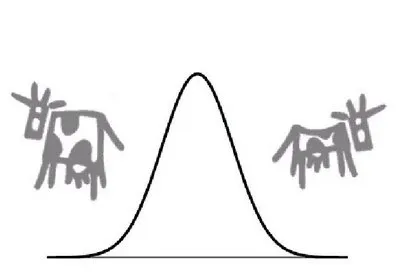
Click on the image to enlarge.
What you see in the Exxon graph is similar: growth, peak, and decline, but the curve is far from being symmetric. Why is that?
The Hubbert model is an approximation, like all models. The idea is that the industry extracts first the least expensive resources. In the case of crude oil, good resources are low-depth, large, and high-purity fields. Then, as these “easy” fields are exhausted, the industry is forced to more expensive resources, e.g. deep oil, contaminated oil, offshore oil, etc. Since extracting costs more, profits will go down unless prices are raised, but that may cause consumers to reduce their oil demand, and that will also reduce profits.
The Hubbert model does not directly take prices into account but makes the broad assumption that producers will keep re-investing a constant fraction of their profits into new production. If you describe this concept as equations, the result is the Hubbert curve. You can read the details in a paper by Alessandro Lavacchi and me. The Hubbert model is reasonably good in many cases when the industry moves from one productive region to another, abandoning the old wells to move to new ones to keep profits at a relatively constant level.
But, as I said, the Hubbert model is an approximation. The Exxon diagram is a good qualitative illustration of the effects of changing the assumption of a constant fraction of profits reinvested. What happens if the industry reinvests little or nothing into production? The result is the curve that defines the blue area in the graph: a nice case of a “Seneca Curve” (growth is slow, but decline is rapid). It is what you expect: no investments, no production. The whole system rapidly collapses because of a lack of resources.
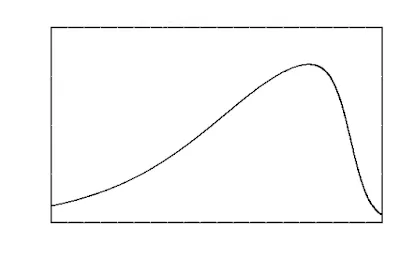
Click on the image to enlarge.
The red area curve in the Exxon diagram shows something similar to the simple Hubbert model. The industry increases its investments, but not enough to avoid decline. Finally, the light gray curve shows the results of heavy investments in new resources, enough to keep production constant. There is also another possibility, not shown in the graph. The curve can keep growing if the industry can invest truly large resources into new resources, no matter how expensive. It is what happened when the US oil industry invested heavily in “shale oil.” It completely reversed the decline in production that had been ongoing in the US since the local Hubbert peak in 1970.
Exxon's logic is simple and brutal but correct. If you give us more money, we’ll give you more oil; otherwise, forget it. Yes, but where is this money going to come from? In the basic Hubbert model, it comes wholly from the industry’s profits, but in the real world, money comes from the financial sector, which draws it from all sectors of the economy.
The economy is all about allocating resources, and it is a zero-sum game. If you allocate more resources to support the oil industry, you must take them from other sectors: salaries, pensions, health care, social services, consumer spending, etc. Taking them from the military sector would be a better idea, but the military does not agree, and they have more clout than middle-class people. It is the same for politicians.
It is not a novelty; the process has been going on for the past few decades and is a good explanation of current social and economic trends. Make no mistake: we are talking of huge amounts of money. The fraction of the US GDP derived from the fossil fuel industry is estimated as 8%. On average, the oil and natural gas industry accounts for about 16% of all industrial investments. So, it is not surprising that the poor are becoming poorer, and the middle class is disappearing. Consumer spending is a luxury that Western society may not be able to afford anymore in the near future.
Real-world data confirm this assessment, at least qualitatively. The global investments in terms of capital expenditures (Capex) in the oil and gas industry increased until 2016, in parallel with a substantial effort to keep production up after it peaked in 2008. From then on, it decreased. The reasons are hard to pin on a simple cause, but the industry likely decided to cash in after the big effort it made with the development of the shale oil sector (several sources tell that explicitly). But now, a new cycle is starting: the industry is discovering that production will decline unless substantial investments are made. And there comes the Exxon report with its request for more money. Everything that happens has a reason for it to happen.
And now? As usual, the future is a foggy glass. If the history of the first two decades of the 21st century will repeat, the financial system may decide to pour huge resources into exploiting expensive resources to produce liquid fuels. Maybe more shale oil, or perhaps some extravagant adventures in such things as oil shales or synthetic fuels from coal. That could postpone the production cliff for at least a couple of decades. It would mean beggaring ourselves in the name of profit, to say nothing about the consequences on climate. But this is the way the human mind works.
More likely, the global economic contraction and the development of alternative energy and transportation technologies will cause a rapid decline in the demand for liquid and gaseous fuels. That will turn the “blue” curve in the Exxon diagram into reality and send the whole oil and gas industry down the Seneca Cliff.
It will end an activity that has caused enormous damage to every living being on this planet. That doesn’t mean adapting to a fossil-free world will be a pleasant experience for humankind, but that’s how the universe works. When you hear a voice from the sky rumbling the words “Seneca Cliff,” prepare to tumble down!