This supplement presents a provisional synthesis of currently available knowledge and data. The synthesis is presented in the form of a concept that integrates the social, economic, and energy issues that must be resolved to attain a civilized (i.e., humane) transition during the 21st century. Energy balance for entropy control is a non-negotiable requirement, and gender balance for integral human development is an indispensable catalyst for the transition. The scenario is presented next from the process, time-phasing, and system perspectives:
INTEGRATED TRANSITION SCENARIO - PROCESS VIEW
|
The following is a conceptual diagram of the sustainable development process:
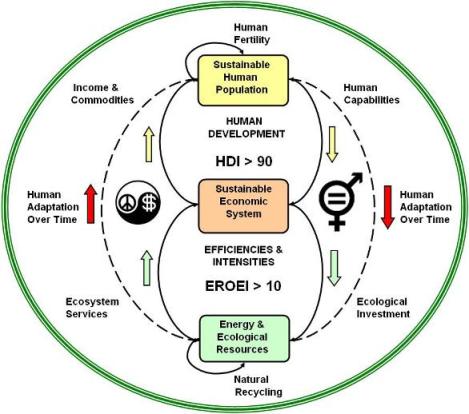
Bounded Population-Economic-Ecological System for Sustainable Human Development
Adapted from Prosperity without Growth, Tim Jackson, 2011, Figure 12.1, Page 195.
|
SUSTAINABLE DEVELOPMENT SIMULATION (SDSIM)
For information about SDSIM 1.0 and 1.5, click here.
For the equations and data of SDSIM 1.0 and 1.5, click here.
|
BASIC ARCHITECTURE OF THE SIMULATION MODEL
|
There are three sets of feedback loops: human development, human adaptation, and industrial mitigation. The human development loops (yellow arrows) improve gender equality and other human capabilities, and guide the allocation of income/commodities generated by the economic system. The human adaptation loops (red arrows) drive ecological investment so as to enhance the sustainability of ecosystem services. The industrial mitigation loops (green arrows) improve the productivity of energy and other resources by using "industrial engineering" methods. The working hypothesis is that mitigation loops are helpful as long as their operation is subservient to, and do not interfere with, the human development and human adaptation loops.
The convergence of gender balance, energy balance, and sustainability emerges from gender imbalance and energy imbalance jointly driving human civilization toward unsustainability. Many other factors are involved, but gender and energy imbalances are the most pervasive, and balancing them would have a neutralizing effect on all the other factors that conspire against a sustainable human society. If the transition from consumerism to sustainability is to be attained in a timely and civilized manner, i.e., before it is too late and minimizing violence as much as possible, balancing gender relations and energy flows would be the best (perhaps the only?) way to go.
INTEGRATED TRANSITION SCENARIO - PHASES VIEW
|
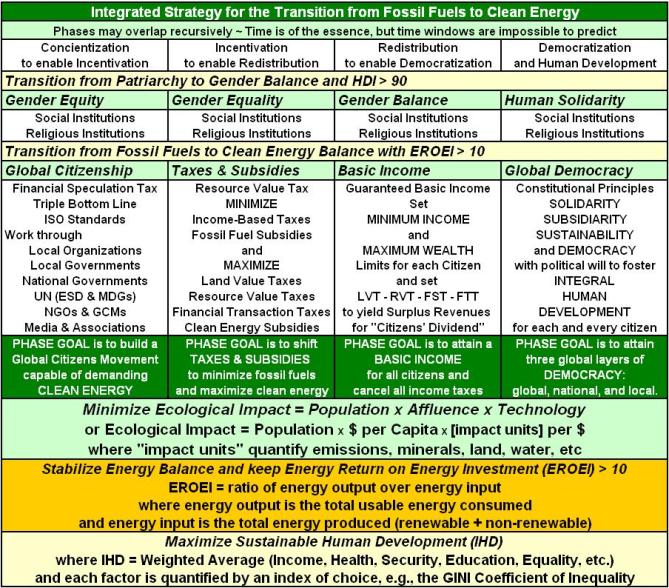
There are four phases: concientization, incentivation, redistribution, and democratization. Phases may overlap recursively. Time is of the esence, but the specifc start/end dates for the time windows are impossible to predict.
Acronyms and Links to References
The following acronyms, and terminology are used in this transition concept and subsequent discussion:
Energy Return on Investment (EROI)
Energy Return on Energy Investment (EROEI)
Financial Transaction Tax (FTT)
Global Citizens Movement (GCM)
Global Domestic Product (GDP)
Genuine Progress Indicator (GPI)
Human Development (HD)
Human Development Index (HDI)
Human Development Report (HDR)
Integral Ecology (IE)
Integral Human Development (IHD)
International Standards Organization (ISO)
Kaya Identity (KAYA)
|
Land Value Tax (LVT)
Maslow's Hierarchy of Human Needs (MASLOW)
Non-Governmental Organization (NGO)
Principle of Solidarity (SOLIDARITY)
Principle of Subsidiarity (SUBSIDIARITY)
Principle of Sustainability (SUSTAINABILITY)
Resource Value Tax (RVT)
Sustainable Development (SD)
Sustainable Development Simulation (SDSIM)
Sustainable Human Development (SHD)
Triple Bottom Line (TBL)
Universal Basic Income (UBI)
|
The formula I=PxAxT, known as "Ehrlich's Equation," is generally recognized as a good model for the ecological impact of economic activity. The impact is a nonlinear function of human population (P, # of persons), affluence (A) measured as consumption per capita ($/person), and a technology factor (T) that quantifies the impact (in physical units) per dollar of consumption. Note that for impact (I) to decrease, the technology factor (T) must go down faster than the product of population (P) and lifestyle (A) grows.
|
Several formulations are possible for IHD. The best known is the United Nations' Human Development Index (HDI) which includes three components: life expectancy, years of schooling, and GNP per capita. The are many variations of the HDI to include, for example, the gender equality dimension. Other indices attempt to replace GNP with other measures of human wellbeing, such as the Genuine Progress Indicator (GPI), the GINI Cofficient of Inequality, and the Happy Planet Index (HPI).
|
|
The transition entails maximizing human development and wellbeing as much as possible, and minimizing ecological impacts as much as possible, in a manner that leads to economic and ecological stability. Clearly, maximizing human wellbeing and minimizing ecological impact are mutually contradictory goals as long as human wellbeing is measured in terms of material consumption per capita. Since there are resource limits, and there are limits to efficiency improvements via technological innovation, something must give: humans must adapt by shifting expectations of wellbeing from economic affluence to other human development goals. It is impossible to predict how this adaptation process will unfold, but the following synopsis of the transition phases is proposed as a point of reference:
The first phase is concientization to enable incentivation. The objective is to create widespread popular support for the required revisions of tax codes and energy subsidies. In other words, the first phase is about creating a collective mindset of global citizenship and social responsibility, strong enough to translate into political will to face the inevitable transition and implement required reforms. Gender equity is key.
The second phase is incentivation to enable redistribution. The objective is to reform tax codes and energy subsidies to expedite the transition from fossil fuels to clean energy. Applicable reforms include shifting taxes from earned income to the usage (extraction) of unearned resources and the release of pollution, as well as taxing financial transactions of dubious social value. Gender equality is key.
The third phase is redistribution to enable democratization. The objective is to institutionalize democracy with gender balance and distributive justice. This may entail adopting a Universally Guaranteed Personal Income (i.e., a basic minimum income rather than a minimum wage) and a Maximum Allowable Personal Wealth (i.e., an upper limit on financial wealth accumulation) that can be democratically adjusted periodically.
The fourth phase is worldwide democratization. The objective is democratization of global, national, and local governance with deeply ingrained gender balance and widely institutionalized implementation of the solidarity, subsidiarity, and sustainability principles. Decisions are to be made at the lowest possible level consistent with governance capabilities and the common good of humanity.
The four phases are not envisioned to be strictly sequential. They most probably will overlap, with recursions and convulsions along the way. The term "gender equality" is not to be understood as "gender uniformity." By gender equality is meant equality of dignity and personal development opportunities across the entire gender continuum. In other words, full equality in all dimensions of human life: physical, intellectual, psychological, vocational, spiritual. The term "clean energy" is to be understood as "clean renewable energy" that is naturally replenished and does not produce GHG emissions when used. It does not include absurdities such as "clean coal." The combination of gender balance and energy balance is hereby proposed as the necessary and sufficient driver for a civilized (i.e., humane) transition, and are expected to have a multiplying effect throughout the global human system.
INTEGRATED TRANSITION SCENARIO - SYSTEM VIEW
|
SYSTEM VIEW OF THE SUSTAINABILITY PARADOX
The following diagram represents the present world human system:
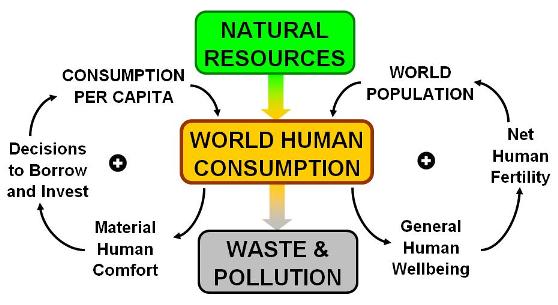
THE SUSTAINABILITY PARADOX
The positive signs indicate positive (self-reinforcing) feedback loops
Based on the Ecocosm Paradox Diagram by Willard R. Fey & Ann C. W. Lam, 1999.
The downward flow at the center is the flow (lifecycle) for all kinds of merchandise. The feedback loop on the right-hand side is the population growth process. The feedback loop on the left-hand side is the economic growth process. If human consumption keeps increasing, natural resources are depleted and pollution accumulates. If human consumption decreases/stabilizes, the current economic/financial system destabilizes/collapses. This is the "infinite growth in a finite planet" paradox, which is more commonly referred to as the "sustainable development" paradox or simply the sustainability paradox.
The connecting arrows in the diagram indicate a ceteris paribus direction of influence. In the current world system the sense of every influence is positive, i.e., "more" leads to "more." However, the strength of the influence may change with time depending on various factors. For instance, the strength of the influence from "General Human Wellbeing" to "Net Human Fertility" may decrease after a certain threshold of wellbeing, higher levels of education, and accesibility to reproductive heath care. The strength of the influence from "Material Human Comfort" to "Decisions to Borrow and Invest" may increase when lines of credit with low interest rates are easy to obtain.
SYSTEM VIEW OF THE SUSTAINABILITY PARADOX
WITH SUPERIMPOSED TRENDS
The following diagram represents the present world human system with samples of recent trend data for population, consumption, and the physical flows of energy and materials:
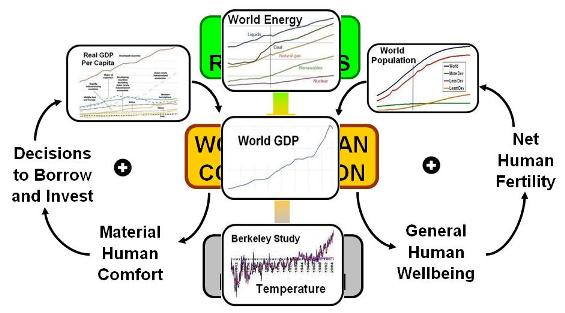
THE SUSTAINABILITY PARADOX WITH SUPERIMPOSED TRENDS
World Population 1950-2100 (UNDATA, 2010 Revision)
World Consumption Per Capita 1965-1995 (World Bank, 2011)
World Human Consumption 1960-2009 (World Bank, 2011)
World Energy Consumption 1990-2035(DOE EIA, IEO 2011)
World Average Land Surface Temperature 1800-2005 (Berkeley Earth, October 2011)
At the moment, the world's population is approximately 8 billion people but the rate of growth may be slowing down. Global consumption of goods and services is approaching 60 trillion dollars, with 80% of commodities going to 20% of the population. Empirical data shows that consumption is growing faster than population, even though over one billion people remain in abject poverty. The global financial system is in total disarray. Worldwide, the rich-poor gap is increasing increasingly. Billions of tons of minerals and fossil fuels are being extracted from the earth each year, and billions of tons of waste and pollutants are being dumped back into the environment. Climate change, induced by global warming, is already impacting some human communities. Specific numbers are important, but recent growth patterns and their projected continuation are the main concern. It is impossible to predict the timing of forthcoming events, but it is reasonable to anticipate that infinite material growth in a finite planet is a mathematical impossibility.
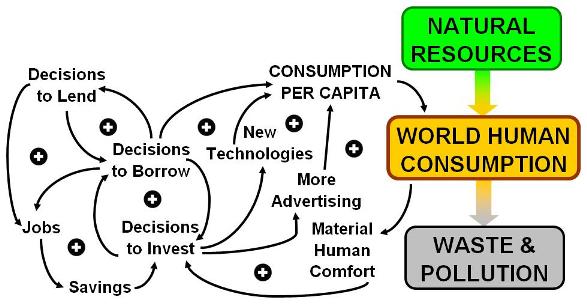
The above hypothesis on how economic growth dynamics unfold can be refined in many different ways. For instance, the following diagram includes only the economic growth loops (left portion of the diagram) to show additional investment loops on financial credit, job creation, technology development, and advertising. Now we have a multiplicity of positive feedback loops that reinforce each other and jointly reinforce human consumption, as in the following diagram:
SYSTEM VIEW OF THE SUSTAINABILITY PARADOX
WITH MULTIPLE ECONOMIC GROWTH & JOB CREATION LOOPS
The following diagram represents the present world human system with added detail on job creation in conjunction with the economic growth process:
Another way to expand the hypothesis is by including the financial growth loops whereby banks lend to industry and, in addition, lend to investors seeking financial gain for the sake of financial gain (i.e., nothing is produced or consumed). Such is the case, for example, when investor A borrows money from bank X at a given interest rate, then lends the money to investor B at a higher interest rate and pockets the additional gain. This kind of financial speculation activity (which is perfectly legal and facilitated by currencies no longer being under the gold or some other tangible resource standard) that may lead to financial bubbles and crises as happened recently in the USA and more recently in Europe. Consider the following diagram:
SYSTEM VIEW OF THE SUSTAINABILITY PARADOX
WITH MULTIPLE FINANCIAL GROWTH LOOPS
The following diagram represents the present world human system with added detail on the financial dimension of the economic growth process:
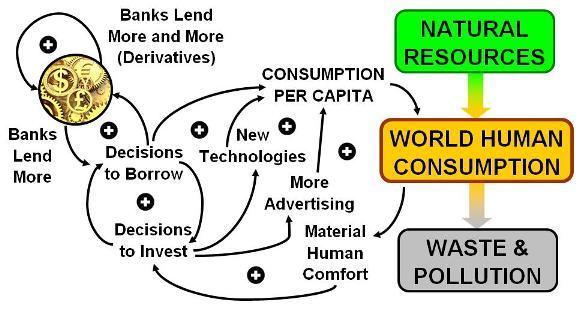
There is empirical evidence that total world population is now increasing decreasingly, so current economic conditions suggest focusing on the economic side of the sustainability paradox. The economic growth process is driven by growing consumer demand for additional material comfort in the form of goods and services. This induces decisions to invest for expansion of industrial capacity, new technologies, and more advertising. Banks reinforce investment by lending to investors, and also by lending to consumers eager to increase their per capita consumption, which is currently growing faster than population. Since the dollar and other currencies are no longer based on gold, banks also can lend for trading in derivatives and other "financial weapons of mass destruction." This unbriddled capital accumulation process, driven by short-term profits and a systematic discounting of the future, assumes that there can be infinite growth in a finite planet, and actually requires continued and unlimited growth to keep functioning. This is the essence of the sustainability paradox.
SYSTEM VIEW OF THE SUSTAINABILITY PARADIGM
The following diagram represents the future world human system:
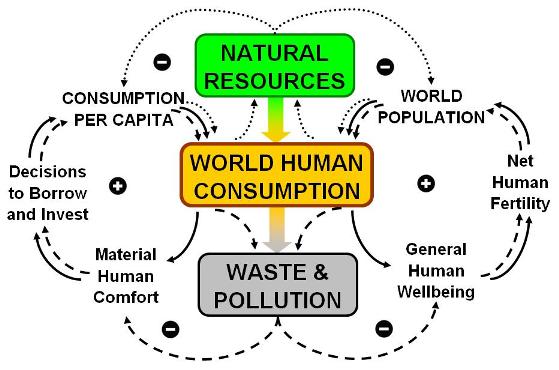
THE SUSTAINABILITY PARADIGM
The positive signs indicate positive (self-reinforcing) feedback loops
The negative signs indicate negative (self-correcting) feedback loops
The new connectors at the top linking natural resources to population and consumption per capita create adaptation loops (dotted lines). As long as natural resources are not limiting, these loops remain inactive. When one or more natural resources (e.g., minerals, water, fossil fuels) become limiting, resource prices are bound to increase and adaptation must take place by limiting population growth, economic growth, or both. On the economic side, this entails reducing consumption, substituting one resource by another, or both.
The new connectors at the bottom linking waste/pollution accumulation to human comfort (material or otherwise) are mitigation loops (dashed lines). As long as environmental degradation does not affect human comfort, these loops remain inactive. When the accumulation of pollutants is such that human well-being (material comfort, health, etc.) is impacted, the costs of environmental remediation are bound to increase and mitigation must take place by shifting priorities from comfort to survival.
SYSTEM VIEW OF THE SUSTAINABILITY PARADIGM
WITH EMBEDDED INPUT-OUTPUT MATRIX
The following diagram represents the future world human system enhanced to show the vector of resource intensities, the matrix of inter-industry transactions, and the vector of emission factors:
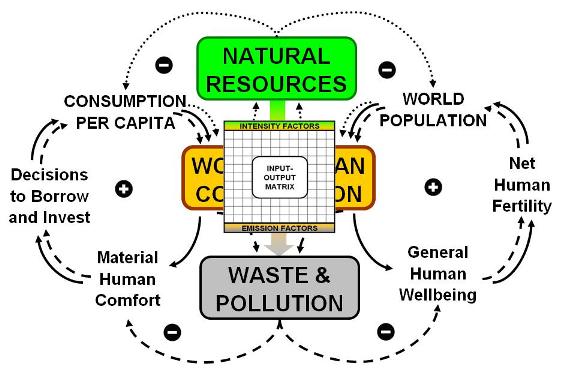
THE SUSTAINABILITY PARADIGM WITH EMBEDDED INPUT-OUTPUT MATRIX
The positive signs indicate positive (self-reinforcing) feedback loops
The negative signs indicate negative (self-correcting) feedback loops
Intensity factors are in resource input units per unit of merchandise produced
The input-output matrix is the Leontief matrix of interindustry transactions
Emission factors are in emission output units per unit of merchandise consumed
When the mitigation and adaptation loops are activated, analysis of possible trade-offs and substitutions will require an embedded inter-industry transactions matrix. How specificity of the analyzable trade-offs will be contingent on the granularity of industry decomposition captured by the input-output matrix. For instance, the North American Industry Classification System (NAICS) divides GDP into 24 major industry sectors which in turn are decomposed into a total of 2228 industries. The web-based Economic Input-Output Life Cycle Assessment (EIO-LCA) at the Green Design Institute, Carnegie Mellon University, divides GDP into 27 "broad sector groups," each further decomposed into a number of "detailed sectors." See also the System of National Accounts (SNA), United Nations, 2009.
SYSTEM VIEW OF THE SUSTAINABILITY PARADIGM WITH PROPOSED
RESOURCE VALUE TAXES (RVT) AND FINANCIAL TRANSACTION TAXES (FTT)
The following diagram represents the future world human system further enhanced to show self-correcting environmental and financial management loops:
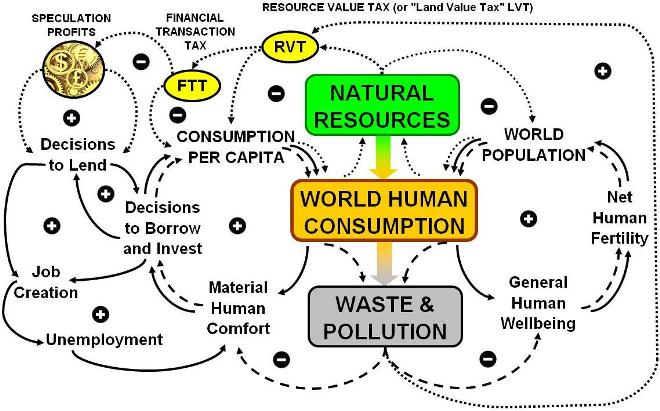
THE SUSTAINABILITY PARADIGM WITH ENVIRONMENTAL & FINANCIAL LOOPS
The positive signs indicate positive (self-reinforcing) feedback loops
The negative signs indicate negative (self-correcting) feedback loops
Resource Value Taxes (RVT) are a function of natural resource depletion/deterioration
Financial Transaction Taxes are a function of RVT and the volume of non-real financial assets
RVT and FTT serve to reinforce job creation and employment opportunities
The formulation of adaptation and mitigation policies will attempt to integrate several dimensions of scientific knowledge and human experience, including gender equality issues, in order to simulate some plausible (but by no means predictive) transition scenarios and trade-offs. For a detailed list of supporting references click here. Nothing is totally unrelated to sustainable human development, and there are many variations of any conceivable transition scenario. Some of the variations to be investigated are identified in the following section.
Architecture of the Sustainable Development Simulation (SDSIM)
SDSIM 2.0 ARCHITECTURE
The architecture of SDSIM 2.0 integrates the sustainability paradox with prospective adaptation/mitigation loops:
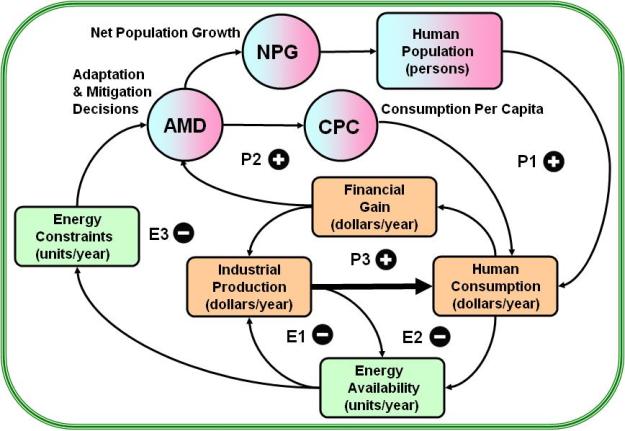
SDSIM 2.0 ARCHITECTURE (WORK IN PROGRESS)
P1, P2, and P3 are the positive population-industrial-financial loops
which currently drive the sustainable development ("infinite growth") paradox
E1, E2, and E3 are negative energy production-consumption and behavioral loops, and
AMD stands for human adaptation-mitigation decisions in response to energy availability constraints
This architecture is proposed as the simplest possible model to capture both the positive (self-reinforcing) feedback loops of the growth paradox and the negative (self-regulating) feedback loops that are bound to emerge during the transition. It is anticipated that dominance will gradually (or not so gradually) shift from the P loops to the E loops as the transition unfolds. The E loops can be generalized to include natural resources other than energy, but energy is the primary concern for SDSIM 2.0. Consideration of other resources, such as water and minerals, is planned for subsequent revisions of the architecture (SDSIM 2.1, 2.2, etc.). AMD is a function of material consumption, financial gain, and energy scarcity and serves to calculate the adaptation and mitigation decisions that are forced by economic and energy constraints. The inverse of AMD is being investigated as a possible model of social cohesion, or the collective capacity to make adaptation and mitigation decisions motivated by human development incentives as opposed to biophysical constraints.
It is critical to take explicitly into account how people and governments will behave in response to changes in the mix of financial profitability and energy availability. What function could be used to model of how people will react to changes in financial profitability and energy scarcity in a given solidarity-sustainability culture? What would be the consequences for population growth (or decline), economic growth (or decline) and quality of life during the transition from consumerism to sustainability? These are the kind of questions to be investigated (via simulation experiments) with SDSIM 2.0. It is understood that social systems are more than closed-loop feedback structures no matter how highly refined the mathematical equations and parameter values. The intent of the SDSIM project is not to provide any final answers but simply to contribute, in some small way, to define more precisely the key questions that must be answered, in a broader context of practicality and wisdom, in order to attain the transition and avoid, to the extent possible, unnecessary human suffering in the process.
Simulation Scenarios of the Transition to Sustainability
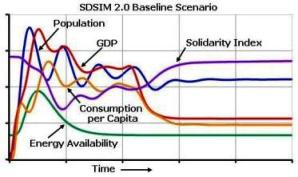
The graphs below are simulations of world population, gross industrial production, average consumption per capita, energy availability, and social cohesion ("solidarity index") trends during 200 years, from 1900 to 2100, and then from 2000 to 2200 by shifting the time window (horizontal axis). The structure of the system is not changing, so the modes of dynamic behavior are not changing. The numerical scales (vertical axis) would have to be recalibrated, but the length of time delays could be shortened to mimic a much faster pace of human agency (including land/resource wars?) and environmental degradation.
|
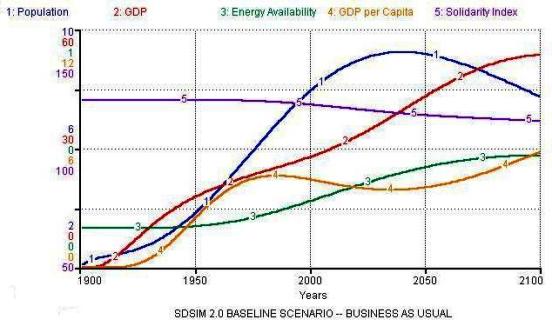
Sustainable Development Simulation (SDSIM 2.0) from 1900 to 2100
|
Due to current chaos emanating from the USA, the transition may be faster:
|
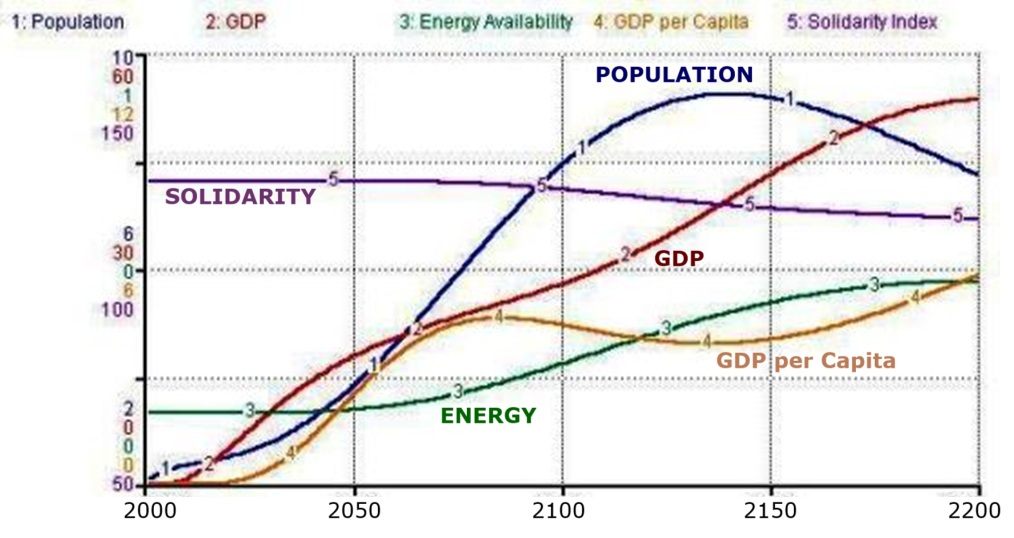
Sustainable Development Simulation (SDSIM 2.0) from 2000 to 2200
|
The following 1900-2900 simulation suggests that, toward the end of the 21st century, population and social cohesion are declining while GDP and per capita consumption are still rising even as energy availability is peaking. Is this leading to a steady-state economy at high levels of production and consumption? The next graph shows the same system with a compressed time window (2000-2200, as shown in the horizontal axis):
|
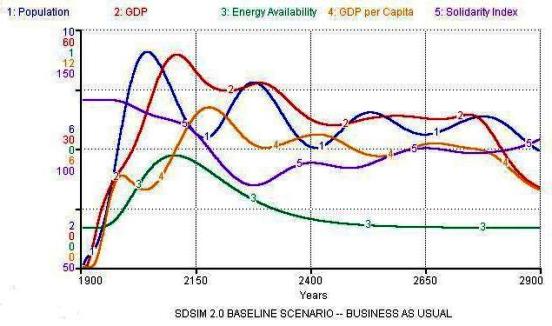
Sustainable Development Simulation (SDSIM 2.0) from 1900 to 2900
|
Due to current chaos emanating from the USA, the transition may be faster:
|
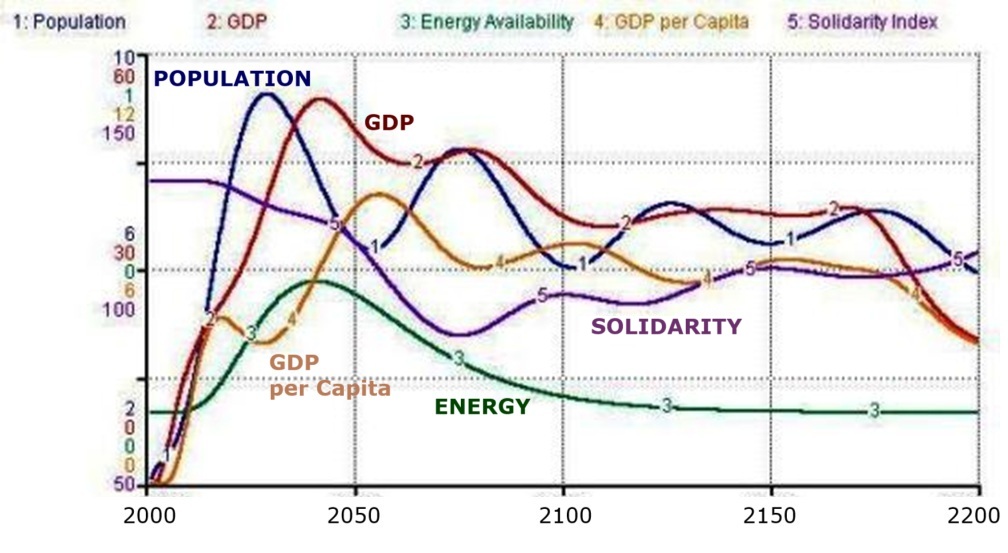
Sustainable Development Simulation (SDSIM 2.0) from 2000 to 2200
|
Due to significant time delays in adjusting population growth and resource consumption rates, and further delays in developing new technologies to "do more with less," the system goes into an extended period of oscillations in population and consumption levels. The amplitude of the oscillations seems to be gradually declining toward new steady-state levels of population and consumption, but at the expense of significant decline in social cohesion (fierce competition over increasingly scarce energy resources?). However, toward the end, drastic adjustments are induced by energy availability returning to the pre-1900 level, i.e., after a very long tail, all fossil fuel resources are finally exhausted. The calculations suggest that another transition would be needed before long-term stability is attained:
|
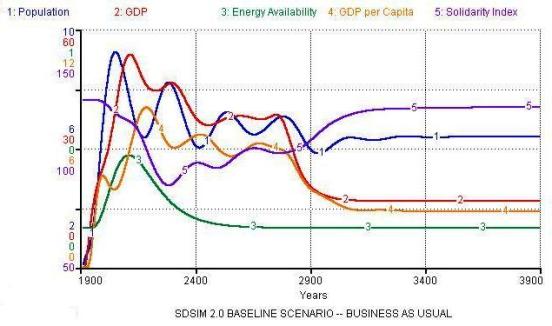
Sustainable Development Simulation (SDSIM 2.0) from 1900 to 3900
|
Due to current chaos emanating from the USA, the transition may be faster:
|
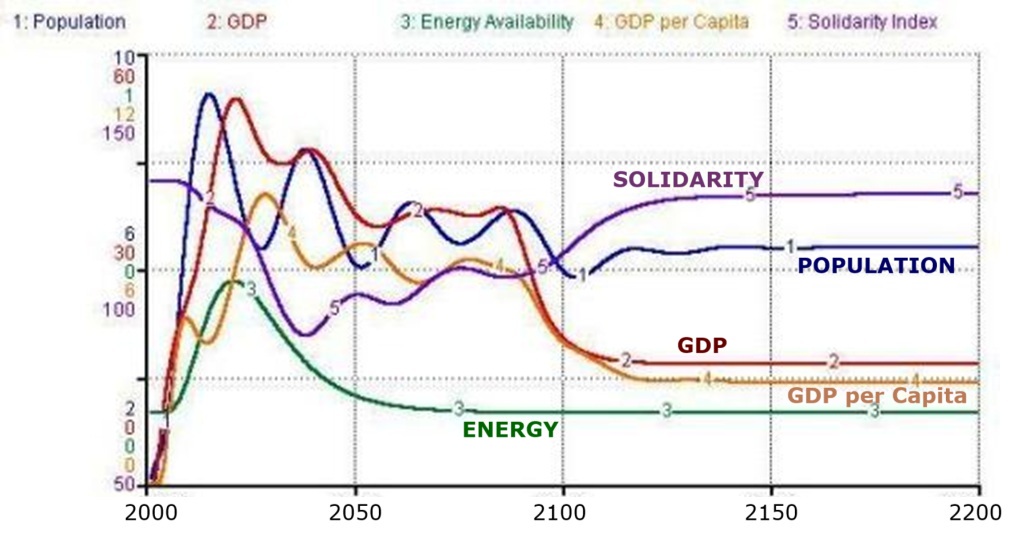
Sustainable Development Simulation (SDSIM 2.0) from 2000 to 2200
|
Beyond 2100, it would seem that the system is leading to steady-state albeit via a long series of oscillations of decreasing amplitude. However, after 2200 or so, energy availability is depleted to just above the 2000 level, or basically solar influx plus of minimum amount of energy from remaining fossil sources. Then, even if massive starvation is avoided by human adaptation, the system adjusts down to a much lower steady-state in terms of population, economic throughput, and "standard of living." Time will tell whether this will make social cohesion decline even further, or eventually induce a much higher level of solidarity (human capacity for virtue out of necessity?) as suggested by the simulation. It cannot be overemphasized that this is a simulation, not a prediction. The simulation simply shows that eventually the system must go back to an energetically sustainable steady-state.
Summary of the Baseline Transition Scenario
|
This is a simulated scenario, not a prediction. It portrays dynamic modes of behavior that can be expected during the transition from consumerism to sustainability. Both simulated time (horizontal axis) and simulated variables (vertical axis) can be adjusted without changing the fundamental patterns of growth, oscillations, and degrowth. During the transition, undoubtedly there will be noise due to short-tem social, economic, and ecological perturbations, but the overall patterns of peaks and valleys will persist in the long-term, as follows:
Population peaking, then oscillating and finally decreasing to a long-term sustainable level. Note time-phasing with GDP and per capita consumption of material goods and services.
The peak in energy availability is followed by a long decline until it settles to the steady-state flow that is allowed by solar (and perhaps other cosmic) sources of energy. The "long-tail" is the result technological developments with gradually decreasing return on energy invested.
The solidarity index is currently formulated as a nonlinear function of human population, material consumption, and energy flows. It is an indicator of social cohesion, which is tightly coupled with the sustainability of resource usage. Solidarity reinforces sustainability and vice versa.
The general patterns of peaks, oscillations, and eventual settling to steady-state are indicative of turbulence during the transition, with high risk of cultural disruptions and violence. The myth of "infinite growth in a finite planet" will not be easy to overcome.
This is not intended to be an "alarmist" scenario. However, it would be wise to take the Precautionary Principle into account when formulation sustainable development policies as we enter the Anthropocene Age.
The past cannot be changed, and the future is unknown. The exact sequence and timing of events cannot be predicted, but the general transitional patterns can be anticipated on the basis of energy biophysics. Specifically, there is empirical evidence to the effect that:
1. Fossil fuel resources are high in energy content but are not infinite.
2. Fossil fuel emissions are environmentally detrimental and/or potentially unsafe.
3. Currently known clean energy alternatives offer relatively low energy content.
Given that fossil fuels are being depleted, pollution levels are damaging the environment, and clean energy alternatives may not provide enough energy to sustain industrial economies, is it wise to just continue doing "business as usual" and trusting that some earthshaking technological breakthrough will come to pass soon enough? Is it fair for people in the "developed" nations to keep indulging in energy consumption and waste while one billion people must subsist on $2 per day or less? How will population growth rate and per capita consumption change in response to impending resource constraints? Will demographic and consumption adjustments be voluntary or involuntary? If they are involuntary, there is a high risk of violence emerging in conjunction with fierce competition for resources throughout the world. Is this "the future we want"?
|
Modeling and simulating the basic variables shown above is feasible (as over fifty years of Limits to Growth analysis has amply demonstrated), and it is self-evident that natural resources (energetic and otherwise) currently being used are not infinite. It is also possible to quantify other physical variables such as polluting emissions, food availability, etc. The big challenge is to formulate mitigation and adaptation decision functions (the AMD node in the architecture diagram) that could reasonably mimic some plausible ways in which human behavior might change as quality of life is impacted and resource scarcities cannot be ignored any longer. Needless to say, the intent is not to be predict but "simply" to analyze, hopefully in a way that yields some useful insight. Easier said than done, as complex financial and cultural factors will come into play.
The Human Development Index, the Environmental Performance Index, the Ecological Footprint, and other such metrics, are useful in the sense that they show the social and ecological impacts of past human decisions. However, they do not take into account how human behavior might change in response to forthcoming dynamics of the transition from consumerism to sustainability. It remains to be seen whether or not such functions can be formulated in a way that is reasonable and useful to enlighten the discussion.
Integration of Human Ecology and Climate Dynamics
|
Feedback Dynamics of Anthropogenic Climate Change
It is becoming increasingly clear that anthropogenic climate changes may be a critical factor forcing human behavior changes during the transition from consumerism to sustainability. A comprehensive model should, therefore, integrate the human and climate systems. In terms of feedback loop structures, the following series of articles may provide a basis for such enhancement of the simulations:
- Why Systems Thinking?, Steve Easterbrook, Serendipity, 20 August 2013.
- The Climate as a System, part 1: the central equilibrium loop, Steve Easterbrook, Serendipity, 22 August 2013.
- The Climate as a System, part 2: energy consumption, Steve Easterbrook, Serendipity, 26 August 2013.
- The Climate as a System, part 3: greenhouse gases, Steve Easterbrook, Serendipity, 27 August 2013.
- The Climate as a System, part 4: earth system feedbacks, Steve Easterbrook, Serendipity, 2 September 2013.
- The Climate as a System, part 5: clouds, Steve Easterbrook, Serendipity, 3 September 2013.
|
ONLINE TOOLS
Limits to Growth (World3 Simulation Model)
The World3 model, developed in the early 1970s for the Club of Rome's report
The Limits to Growth, simulates the interactions between population growth,
industrialization, food production, resource depletion, and pollution. Source:
The World3 Model: Classic World Simulation by Scott Fortmann-Roe, Insight Maker.
 Low Emissions Analysis Platform (LEAP)
Integrated energy, climate change mitigation, and air pollution abatement planning.
Developed and supported by the
Stockholm Environment Institute (SEI).
Visualization of the
Global Techno-Industrial System's
Current Symptoms:
"Business as Usual" on Financial Steroids
This is a visualization of "Business As Usual" (BAU) in the current global economy.
The animation conveys the chaotic agitation currently affecting economies worldwide.
It is BAU in that the goal is still continued growth as cheap natural resources dwindle.
But what about the eventual transition from growth to de-growth and post-growth?
Click on any NODE to start, RESET to stop, REMIX to modify (click on "how to").
Move slider knob to the left for slower BAU, to the right for faster BAU.
The slowest pace (tortoise) is lazy BAU. The fastest pace (rabbit) is chaotic BAU.
The + signs mean that increase in one node induces increase in another node.
The - signs mean that increase in one node induces decrease in another node.
Created with Loopy, a tool for thinking in systems.
Courtesy of Nicky Case.
Artificial Intelligence Tool
BigEarthData.ai
AI environmental intelligence platform dedicated
to protecting the environment, climate, and people
for global ecological sustainability.
For example, select the "Lil Dr Glen EcoChat" search type
and see what you get in response to this question:
Can renewable energy solve population overshoot?
World4.5 Simulation Model
World4.5 Simulation. Click on the image to enlarge.
The model simulates peak world population scenarios based on carrying capacity,
which in turn is based on the interactions between ecological footprint and technology.
Source:
World4.5 Peak Population Simulation by Christopher Bystroff, Insight Maker.
Climate Game
Climatle.xyz
Guess the country from its climate profile.
For any country:
Sectoral GHG, Electricity Mix, GHG Trajectory
Learn about climate change mitigation across countries.
Designed by Sam Rowan