Weve all heard the aphorism Lies, damned lies and statistics. Statistics are an invaluable tool for understanding and responding appropriately to the world, but when the numbers say one thing and the headlines say another, its a cause for concern. TOP takes a dive into World Population Prospects 2022.
The worlds population has grown more than anticipated in the past three years.
That should have been the headline when the United Nations released its latest revision of world population data (World Population Prospects 2022) on 11 July. Instead, the headline was that global population would peak in 2086 at 10.4 billion, about 15 years earlier and half a billion fewer than projected in 2019.
Is this fake news? Why should greater-than-anticipated growth yield lower future growth projections? Lets look at the data they have given us. Apologies if this article is a bit nerdy, but the UN projections play an important role in government planning throughout the world. Any criticism of them needs to be thoroughly justified.
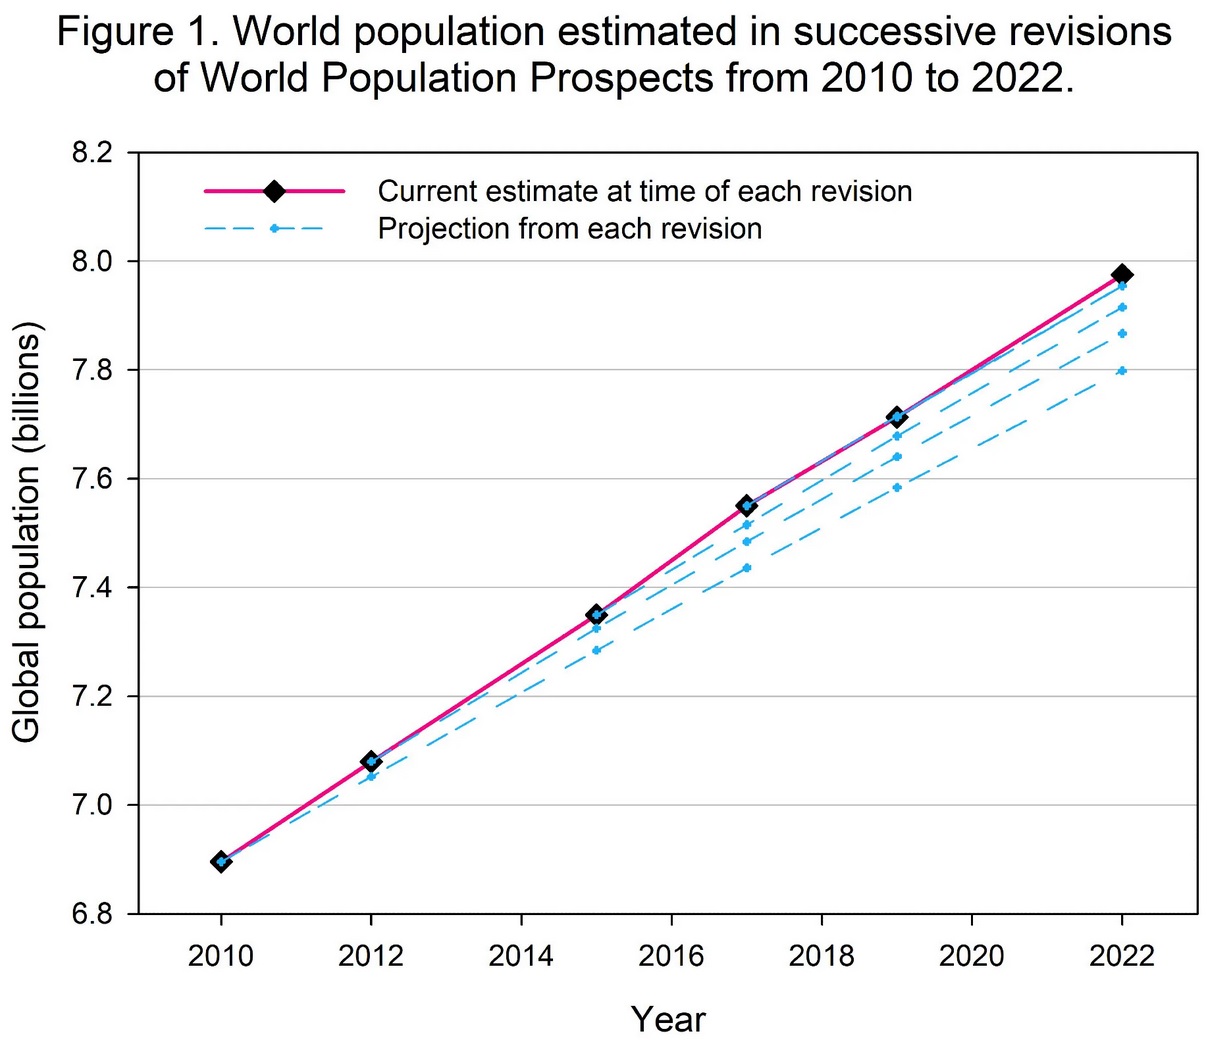
Figure 1 shows the world population as it was estimated in each revision of World Population Prospects (WPP) from 2010 to 2022. The pink line connects each revisions estimate of the current population, i.e. the mid-2010 population as estimated by WPP2010 connected to the mid-2012 population as estimated by WPP2012 etc. Using this rolling-current estimate avoids any bias in the UNs model that might be influencing the slope of the projected line.
In blue dashed lines are the projected growth anticipated in each of those revisions. With the exception of 2019, where recent past estimates closely matched what was expected in 2017, each new revision has concluded that growth since the last update was greater than they anticipated.
Click the image to enlarge.
In 2012, 2015 and 2017, these upward revisions resulted in an upward revision of the projected population throughout this century. In 2019, when the estimate of current population closely matched its 2017 expectation, we might have expected the projection would stay the same too. But instead, the UN anticipated faster future fertility decline than previously and a lower population in 2100 (down from 11.2 billion to 10.9 billion). At the time, I called this out as unfounded.
Now we are told that, in mid-2022, there are 21 million more humans than were anticipated in 2019. The date for reaching 8 billion has been brought forward to 14 November this year two and a half months earlier than expected in 2019. This is despite 15 million excess deaths due to Covid-19 up to December 2021, and more millions this year. The pandemic was not anticipated in the 2019 figures; without it, the population would have been above expectation by 36 million or more, in just three years! Compared with the 2010 projection, a shocking 177 million more people than were expected are present in mid-2022.
Despite this, the new projection is for an even steeper deceleration into the future. Without a good explanation of why the future will behave differently than the past (and I have found none in their documentation so far), this simply defies logic. We often read that the world is adding 80 million people per year. But if we take the UNs estimate for the current population at the time of each issue (the solid line in Figure 1), the average annual increment over this period is 90 million.
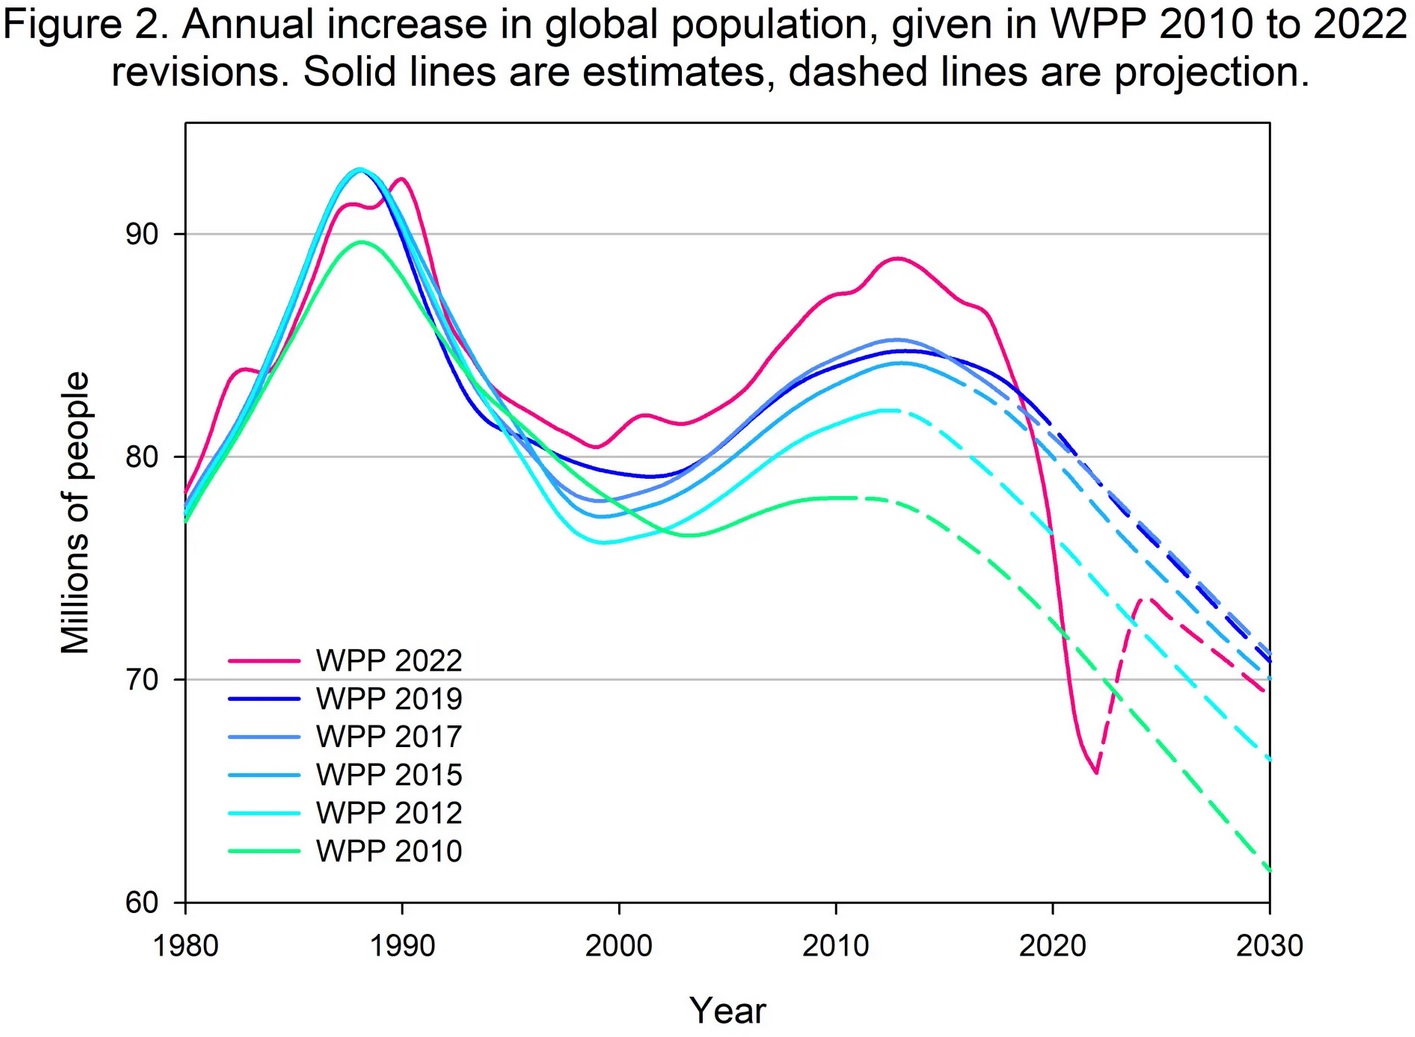
Despite all this, according to WPP2022, some 14 million fewer people were born between mid-2019 and mid-2022 than were anticipated in WPP2019. How can this be? By the usual expedient of revising the past, so that the extra people present are deemed to have been born earlier. This allows the UNs model to keep showing that, despite recalcitrant growth in the past, were on the cusp of a steady decline. Figure 2 shows the annual increment of global population published in each of the recent revisions. It shows how the extra 36 million-or-more people have been spread over the past 30 years. You can see the dramatic effect of the Covid-19-related deaths, but after the pandemic, the increment resumes well below the previous projection. This is despite the higher figures for the past and despite life expectancy resuming its previous upward trend. That is to say, they do not anticipate a lasting impact of Covid-19 on deaths, so the lower future increments are due to more rapid fertility decline, apparently based on wishful thinking.
Click the image to enlarge.
Is it reasonable to project the future to diverge so dramatically from the recent past? A partial explanation is that were coming to the end of the second echo of the post-war baby-boom (in the 1950s to early 60s, more babies in the global north coincided with fewer infant deaths in the global south). The first echo, seen in Figure 2 as the peak around 1989, reflects those big cohorts of baby-boomers becoming parents. The children from that peak are parenting now but the bulge is passing. However, this doesnt explain the revisions repeatedly pushing this bulge out further: the UNs model has always accounted for the size of cohorts entering parenthood. It seems the anticipated decline is repeatedly eluding us. The only explanation for this is that the UNs model has consistently over-estimated fertility decline.
Projected fertility decline continues to be over-optimistic
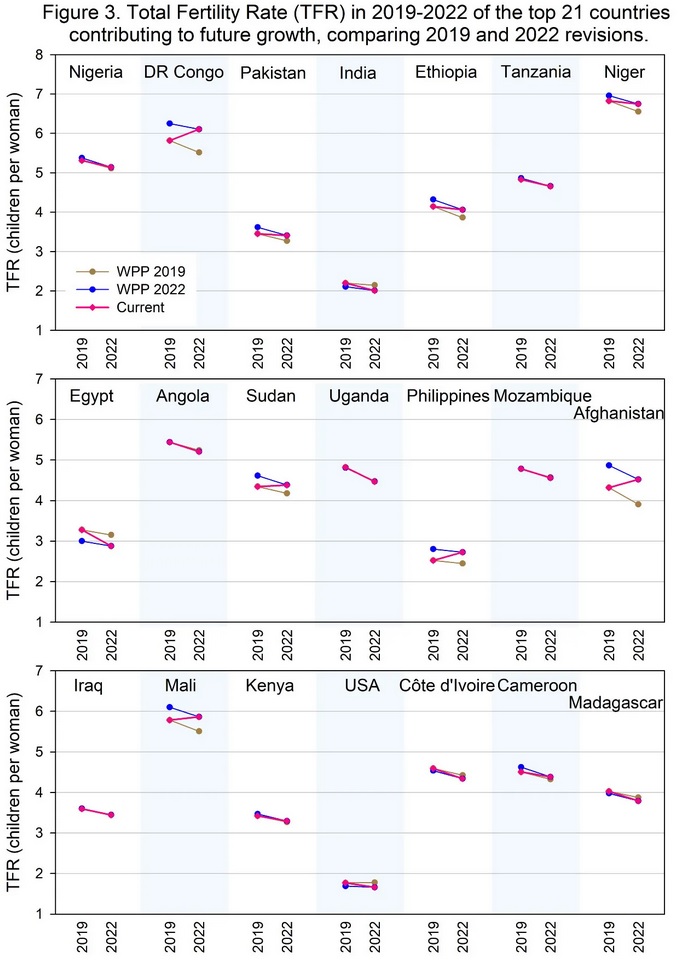
Where is this extra growth coming from? I took a look at the reported fertility rates for the 21 countries the UN projects will contribute most to future growth. Between them, according to WPP2022, they will add 2.4 billion people by the time global population peaks in 2086. That is 97% of the total expected increase in global population. (Other countries will also contribute substantially, but will be off-set by population declines elsewhere.) Figure 3 shows their fertility change between 2019 and 2022, as projected by WPP2019 (interpolated data) and as estimated by WPP2022. Countries are listed in order of their contribution to future growth, from just over 300 million additional people for Nigeria to just under 50 million for Madagascar.
The current fertility line joins the 2019 fertility level that was reported in WPP2019 and the 2022 fertility level that is reported in WPP2022. This might not be more right than either revision but at least it avoids the UN models bias toward giving all high-fertility countries high rates of fertility decline, whether or not this is actually happening. It is exactly this feature of the UNs model that causes each revision to show that the global growth increment has recently started to fall, even if the next revision finds that it hadnt been falling after all. But previous editions are never discussed and not easy to find, achieving a convenient amnesia about past failures and allowing similar claims to be repeated without circumspection.
Click the image to enlarge.
Of hese 21 countries, 12 are reported to have a higher fertility now (according to WPP2022) than was expected in the 2019 projection (i.e. the slope of the pink line is less than the slope of the brown line). Averaging across all 21, fertility is higher than anticipated by 0.1 children per woman. This might not seem much, but it means half of the decline UN demographers expected between 2019 and 2022 did not happen. Five countries (DR Congo, Sudan, Philippines, Afghanistan and Mali) have a higher fertility in 2022 than they were believed to have in 2019 (i.e. the slope of the pink line is upward). That is to say, they have gone backwards.
Of course, the 2022 revision has also revised these countries 2019 fertility upwards (blue lines in Figure 3) and therefore shows a healthy fertility decline for each of them. Whether the revised 2019 numbers are due to new and better information, or are merely the products of a model that doesnt accommodate fertility rebounds, I cant tell. The fact WPP2022 ascribes Afghanistan among the biggest fertility fallsand we all know why its fertility is likely to have risensuggests to me more model-forcing than data-revision. In any case, the data are showing more births and less fertility decline happened over the past three years in these crucial countries than were anticipated in 2019. On these grounds, the projected lower peak population in the 2022 revision is bewildering.
Messaging designed to stifle action
A few countries have had greater fertility decline than expected in 2019. Among the top 21 contributors to global growth, India, Egypt and Madagascar stand out. All have reinvigorated family planning services and public messaging about birth control in the past few years, in an explicit effort to rein in population growth. Others (outside the top-21) with greater than anticipated declines are Malawi and Rwanda, both having governments openly expressing concerns about population growth and promoting family planning.
It would have been nice to see the UN draw attention to this relationship between more government concern about population growth and more fertility decline. Instead, the UNFPA decried any expressed concern about population growth as alarmist.
The key messages published with WPP2022 state that further actions by Governments aimed at reducing fertility would not have a major impact on the pace of growth between now and mid-century. While they concede that action now could have an impact in the second half of the century, this is a mere caveat, not a key message. While we all appreciate the power of population momentum, it is wrong to play down beneficial actions just because they have a long lead-time. The climate crisis we now face is largely due to leaders not acting early enough because the impacts were too far in the future.
It is also wrong to infer that impacts of more rapid fertility decline are all decades away. Benefits for health systems and household finances are immediate, the education system benefits within a decade, and employment prospects could be substantially improved within two decades as smaller age cohorts come through. That the biggest benefits might be decades away is all the more reason for the UN to champion them, to counter the political short-termism of national governments.
The WPP2022 key messages also say the pace of growth is slowing down, a false statement since (Covid-19 aside) no downward trend in the annual increment has yet been established (see Figures 1 & 2). When the eighth billion person arrives in November this year, it will be the fastest billion weve ever added. The falling percentage growth rate is attributable to the rising total population (the same increment divided by a bigger number yields a lower rate), but it does not mean that the pace has slackened.
All of this rhetoric is consistent with perpetuating the myth that the Cairo agenda has been successful, not only in providing better reproductive health services for women but that it would also lead to lower population growth than targeted efforts for birth control. This is not what the data tell us. What we are seeing is the abject failure of the strategy to halt population growth by suppressing any mention of it. It has failed to deliver elevated access to family planning services, it has failed to accelerate fertility decline, and it has failed to lower population growth rate, compared with the many earlier successful examples of targeted efforts for birth control. Consequently, it has brought more poor countries to the brink of food and water insecurity and locked them into cycles of poverty.
I can imagine the political pressure on the UN demographers to deliver an affirmation of the Cairo agenda. A higher-than-expected projection would place the whole strategy under scrutiny. It would also put them further out of kilter with projections issued by the Institute for Health Metrics and Evaluation (IHME) and the IPCCs SSP scenarios. The Summary document for WPP2022 discusses these in a subtly critical way, noting that while they may be plausible for high-fertility countries individually, they depict rather unlikely outcomes for regional and global aggregates. For my critiques of these projections see here for IHME and here for SSPs. What all of them have in common is the assumption that fertility is determined by development and education outcomes, not by targeted efforts for birth control through voluntary, rights-enhancing but nevertheless assertive actions of governments and NGOs. This is in denial of research that shows family planning effort is by far the strongest determinant of fertility decline.
Where WPP2022 should have been a call to action, it makes an explicit call to inaction. At this point in our global environmental and security crises, this is an unconscionable failure.
|
ABOUT THE AUTHOR
Jane OSullivan is Honorary Senior Research Associate at the School of Agriculture and Food Sciences, University of Queensland, Australia. She is a cross-disciplinary researcher with interests in environmental protection, human ecology, and sustainable development. As an agricultural scientist, for 15 years she researched crop nutrition and soil fertility management for tropical root crops in developing country settings. Realising that population growth tends to overtake agricultural productivity gains, exacerbating poverty and environmental impact, she turned attention to the drivers of human fertility reduction and the cultural contexts, policies and programs influencing it. She is active in policy advocacy for climate change response, steady state economics, and sustainable development.
|


![[groups_small]](groups_small.gif)