
|
Mother Pelican
A Journal of Solidarity and Sustainability
Vol. 17, No. 5, May 2021
Luis T. Gutiérrez, Editor
|
|
|
|

|
|
|
|
|
Significance: The current biodiversity crisis is often depicted as a struggle to preserve untouched habitats. Here, we combine global maps of human populations and land use over the past 12,000 y with current biodiversity data to show that nearly three quarters of terrestrial nature has long been shaped by diverse histories of human habitation and use by Indigenous and traditional peoples. With rare exceptions, current biodiversity losses are caused not by human conversion or degradation of untouched ecosystems, but rather by the appropriation, colonization, and intensification of use in lands inhabited and used by prior societies. Global land use history confirms that empowering the environmental stewardship of Indigenous peoples and local communities will be critical to conserving biodiversity across the planet.
Abstract: Archaeological and paleoecological evidence shows that by 10,000 BCE, all human societies employed varying degrees of ecologically transformative land use practices, including burning, hunting, species propagation, domestication, cultivation, and others that have left long-term legacies across the terrestrial biosphere. Yet, a lingering paradigm among natural scientists, conservationists, and policymakers is that human transformation of terrestrial nature is mostly recent and inherently destructive. Here, we use the most up-to-date, spatially explicit global reconstruction of historical human populations and land use to show that this paradigm is likely wrong. Even 12,000 y ago, nearly three quarters of Earths land was inhabited and therefore shaped by human societies, including more than 95% of temperate and 90% of tropical woodlands. Lands now characterized as natural, intact, and wild generally exhibit long histories of use, as do protected areas and Indigenous lands, and current global patterns of vertebrate species richness and key biodiversity areas are more strongly associated with past patterns of land use than with present ones in regional landscapes now characterized as natural. The current biodiversity crisis can seldom be explained by the loss of uninhabited wildlands, resulting instead from the appropriation, colonization, and intensifying use of the biodiverse cultural landscapes long shaped and sustained by prior societies. Recognizing this deep cultural connection with biodiversity will therefore be essential to resolve the crisis.
Keywords: agriculture, hunter-gatherer, extinction, conservation, Anthropocene
|
|
Multiple studies confirm that ecosystems across most of the terrestrial biosphere, from 75 to 95% of its area, have now been reshaped to some degree by human societies (1?3). With a few exceptions (e.g., refs. 4???8), this global anthropogenic transformation of terrestrial nature has been described by natural scientists as mostly recent: the product of the industrial era (9???13). This is partly because previous global reconstructions of early populations and land use systematically ignored these earlier transformations (1, 5, 14) and partly due to the conservation communitys focus on recent industrial changes (2, 3, 9, 15). There has also been a history of natural scientists and conservation practitioners interpreting terrestrial ecosystems as uninfluenced by long-sustained interactions with human societies, ignoring prior histories of land use, especially by Indigenous societies (16?18). While this paradigm has increasingly been questioned with respect to long-term global changes in climate (19), fire regimes (20), and biodiversity (7, 8, 21), it continues to have real-world consequences, including failed policies of fire suppression, wildlife management, and ecological restoration, as well as the repression and removal of Indigenous peoples from traditional lands and waters and the erasure of their extensive knowledge of effective ecosystem management practices, thereby undermining their sovereignty over these ecosystems (17, 22?24). Here, we examine contemporary global patterns of biodiversity and conservation in relation to the spatial history of human populations and land use over the past 12,000 y. Specifically, we use spatially explicit global datasets to visualize histories of human use in areas identified as biodiversity-rich and high-priority for conservation, including those specifically labeled as more natural or wild, and test the degree to which global patterns of land use and population at different times are associated statistically with contemporary global patterns of high biodiversity value and vertebrate species richness and threat within areas prioritized for conservation. Through this examination, we assess the early and sustained global significance of cultural landscapes as a basis for better understanding and conserving terrestrial nature. Anthropological, archaeological, and paleoecological evidence indicate that, at least since the start of the current interglacial interval 11,600 y ago, all human societies were interacting with biota and environments in ways that shaped evolutionary dynamics, ecosystems, and landscapes (25??28). We use the term transformations to describe system-level changes in the social-ecological systems shaped by these interactions, including their initial formation by human inhabitation and the adoption of cultural practices leading to changes in ecosystem state, sensu 5, 27. While the focus is often on negative outcomes relating to these interactions, including extinctions of island endemics (29) and megafauna (21, 30, 31) with cascading ecological consequences (32), there is increasing evidence that human cultural practices can also produce sustained ecological benefits through practices that expand habitat for other species (33, 34), enhance plant diversity (17, 34??37), increase hunting sustainability (38), provide important ecological functions like seed dispersal (39), and improve soil nutrient availability (40, 41). Hunter-gatherers, early farmers, and pastoralists often shared regional landscapes, which they shaped through a wide array of low-intensity subsistence practices, including hunting, transhumance, residential mobility, long- and short-fallow cultivation, polycropping, and tree-fallowing that created diverse, dynamic, and productive mosaics of lands and novel ecological communities in varying states of ecological succession and cultural modification (34, 37, 42). In many regions, these diverse cultural landscape mosaics were sustained for millennia (17, 24, 25, 27, 33, 34, 37, 43?45), contrasting sharply with the more homogenous and continuously used landscapes of larger-scale agricultural societies employing annual tillage, irrigation, continuous grazing, and the extractive and colonial use of land, labor, and other resources to support elites (1, 5, 44). The emergence and spread of increasingly globalized and industrial societies only accelerated this trend toward today's ever more intensively used and homogeneous cultural landscapes shaped by global supply chains, mechanization, chemical nutrients and pest control, leading to ecologically simplified habitats and biotic homogenization through species transported around the world intentionally and unintentionally (1, 44, 46). Assessing Cultural Natures GloballyWe use anthrome classification (1) to characterize the global spatial dynamics of cultural landscapes over the past 12,000 y. Rather than reduce the rich global diversity of cultural landscapes to a single scale of human impact, from low to high (2, 3), anthromes characterize cultural landscapes by stratifying them into a spectrum of discrete categories, analogous to biomes (1), based on their population densities and cover by intensive land uses (crops, pastures, and cities) at a regional landscape scale (~100 km2; Fig. 1). Three basic types of anthromes recognize major differences in land use intensity. Wildlands are characterized by the complete absence of human populations and intensive land uses. Cultured anthromes are less than 20% covered by intensive land uses, and Intensive anthromes are more than 20% covered by intensive land uses. Different anthrome classes are then identified within anthrome types in terms of relative population densities and different forms of intensive land uses; areas of nonintensive land uses, including foraging, hunting, forestry, conservation, fallow, and remnant habitats are generally also embedded within Cultured and Intensive anthrome landscapes in varying amounts (1, 47).
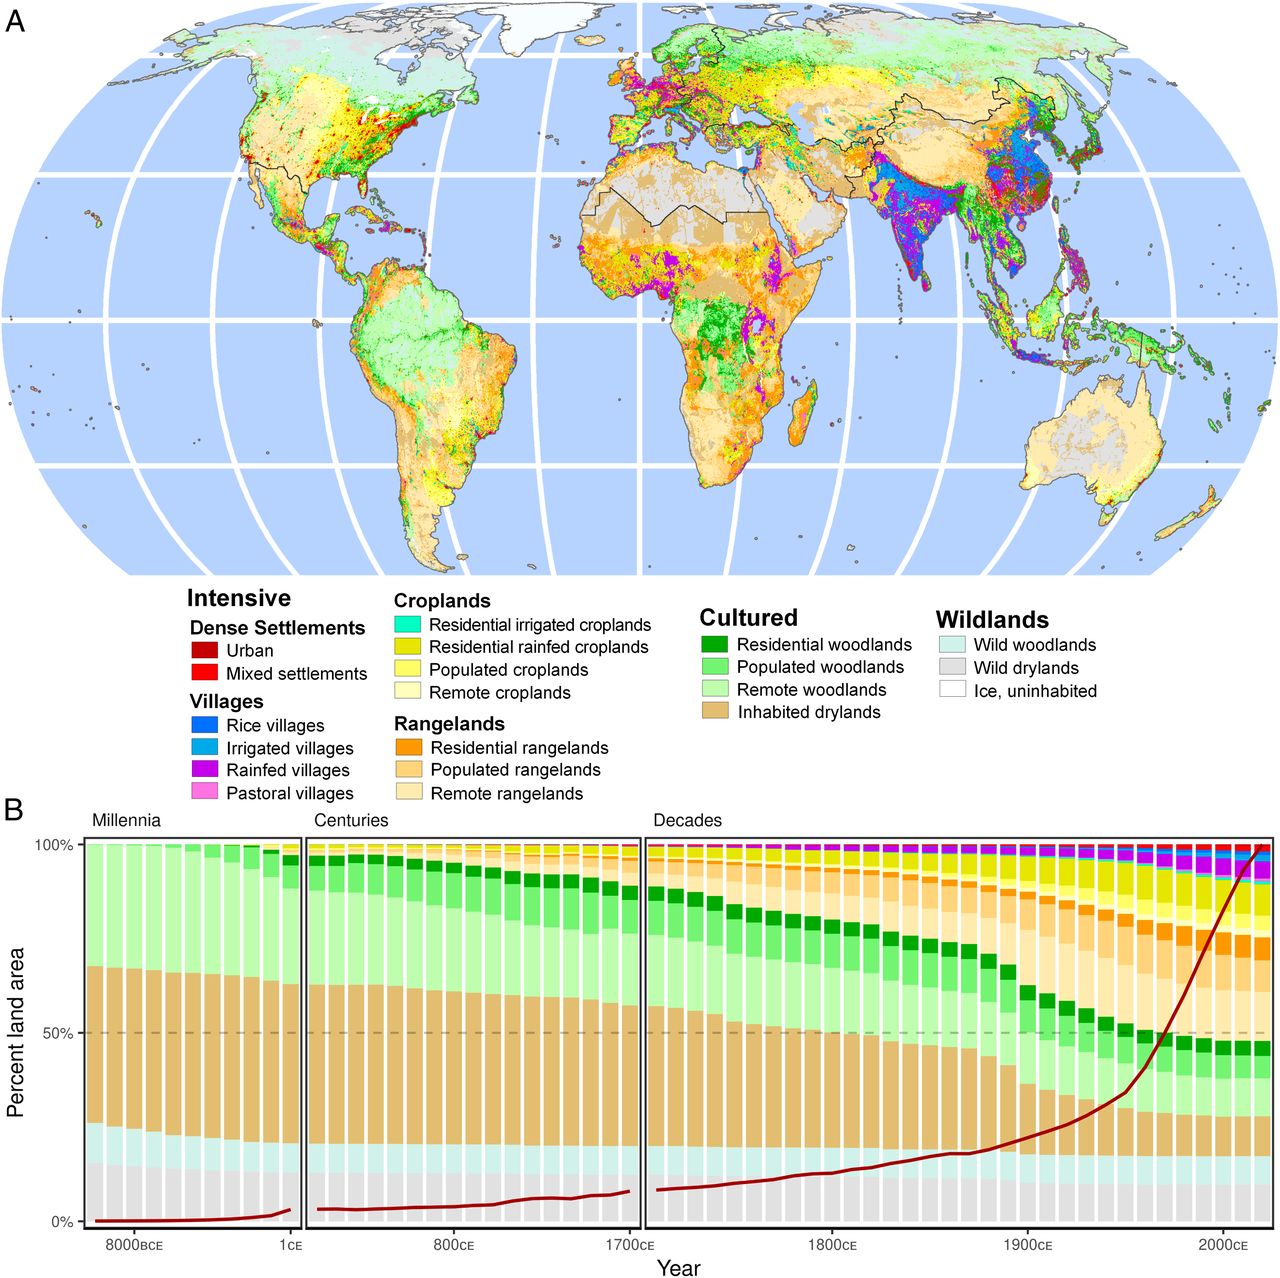
Figure 1. Global changes in anthromes and populations 10,000 BCE to 2017 CE. (A) Anthrome map at 2017 CE (Eckert IV projection). (B) Global changes in anthrome areas, with population changes indicated by red line. Anthromes are classified using population densities and dominant intensive land use. Wildlands are defined by zero population and no intensive land use (urban + crops + grazing), Cultured anthromes have low populations and <20% intensive use, and Intensive anthromes are =20% intensive. Cultured and Intensive anthromes are further stratified by population densities, in persons km-2, as Remote (>0 to <1), Populated (1 to <10), Residential (10 to <100), Inhabited (>0 to <100), Villages and Mixed settlements (100 to <2,500), and Urban ( =2,500). Intensive anthromes are further stratified based on their dominant intensive land use area =20% in order of most intensive use (urban > rice > irrigated > cropped > pastured). Woodlands combine all forest and woodland biomes (73); drylands comprise the remaining biomes, from savanna to tundra, excluding permanent ice. Global uncertainties in SI Appendix, Fig. S1.
|
We stratified the globally significant patterns of human populations and land use into anthromes at 60 time points between 10,000 BCE and 2017 CE (Fig. 1) using a rule-based classification model (1) applied to the most up-to-date and widely used long-term historical reconstruction of these variables now available: HYDE 3.2 (48). HYDE 3.2 represents the latest generation of spatially explicit global models designed to hindcast human populations and land use as input to a wide range of Earth system models, forecasts, and scenarios and includes upper and lower uncertainty estimates (48). Though HYDE 3.2 does not incorporate climate-induced vegetation dynamics or preagricultural forms of land use and is known to underestimate early agricultural land use (5, 26), it nevertheless includes major improvements over prior model generations in representing early populations and land use, especially HYDE 3.1 (48). To avoid statistical biases and to align with contemporary global assessments of biodiversity and conservation (49?51), HYDE data were converted from their native geographic format (5 arc minutes, varying from ~85 km2 at the equator to ~10 km2 at the poles) to an equal area ~96 km2 hexagonal discrete global grid system (DGG), stratifying the terrestrial biosphere into 1,429,024 DGG cells (see Methods). To assess legacies of prior human inhabitation and land use in areas prioritized for conservation, we have visualized the anthrome histories of protected areas [(52), supplemented with data for Chinese protected areas (49)], the Three Global Conditions [3GC (49)], Potential and Likely Natural Areas [NMH (53)], the Human Footprint for 2013 CE (3), and a global map of contemporary government-designated Indigenous territories (51). To assess the degree to which historical spatial patterns of land use and population might have shaped contemporary patterns of biodiversity, we tested for statistical associations between the global patterns of anthromes at different times with those of the Key Biodiversity Areas [KBAs; a widely used indicator of biodiversity significance (54)] and contemporary global patterns of total and threatened vertebrate species richness (55). All global statistical analyses, including spatial data processing, anthrome classification, and assessment of empirical relationships with contemporary global ecological, biogeographic, and societal variables were conducted in an R-based environment (see Methods). A Global History of Anthropogenic NatureBy 2017 CE, more than 80% of the terrestrial biosphere was transformed to varying degrees by human populations and land use (Fig. 1A), with 51% in Intensive anthromes (Fig. 1), 30% Cultured, and just 19% in Wildlands, agreeing well with contemporary global assessments (1, 3, 56). In striking contrast to prior historical global reconstructions, in which Wildlands covered 82% of Earths land in 6,000 BCE [HYDE 3.1 (5)], the current reconstruction shows Wildlands covering just 27.5% of Earths land in 10,000 BCE, 4,000 y earlier (Fig. 1B; uncertainties in SI Appendix, Fig. S1). Although there are substantial uncertainties in this estimate related to model assumptions, this is the result of a far more widespread distribution of low-density populations in HYDE 3.2, indicating that most of terrestrial nature (72.5%) was already inhabited by hunter-gatherer and/or early agricultural societies at the beginning of the current interglacial interval, transforming Wildlands into Cultured anthromes. Since that time, anthrome change trajectories (Fig. 1B and SI Appendix, Fig. S2) confirm that, with some possible exceptions, the majority of human transformation of terrestrial nature, in terms of land area, did not result from recent conversions of uninhabited Wildlands to Intensive anthromes, but rather reflects long-term processes of land use intensification linked with population growth in landscapes already inhabited and used and the increasingly intensive use of landscapes around the world through colonization, displacement, and extraction from local peoples by larger-scale agricultural and industrial economies (26). The global spread of populations and increasingly intensive land use appears largely gradual over the past 12,000 y, although a global acceleration is evident in the late 19th century. This acceleration, which levels off by the middle of the 20th century (Fig. 1B), contrasts sharply with changes in population and other global changes portrayed as the Great Acceleration of the mid-20th century (13). This leveling off is best explained by the use of green revolution technologies to increase agricultural production on lands already in use, a trend that continues today (57). Regional patterns of land use change diverge widely from global trends (Fig. 2; uncertainties in SI Appendix, Fig. S3). Even in 10,000 BCE, Wildlands covered very small extents of Europe, Asia, Africa, and Latin America and the Caribbean (Fig. 2), and already by 1 CE, Intensive agricultural and/or pastoral transformations were underway in parts of every region, following distinct trajectories. These transformation pathways track historical trends in human societies in some regions, including the rise and decline of the Roman Empire in Europe, the Han Empire in China, the expansion of tropical city states circa 1000 CE [e.g., the Ghana Empire (58), Angkor, and the Classic Maya (59)], and the dramatic population declines and social and political devastation caused by colonialism and disease during the Columbian Exchange, circa 1500 CE, across Latin America and the Caribbean (18). Yet, uninhabited Wildlands are depicted as covering nearly half of North America, the Near East, Eurasia, and Oceania in 10,000 BCE (Fig. 2) and change little over time; this is a result that disagrees with much existing evidence of extensive early populations and land use across these regions (16, 18, 26, 33), revealing likely biases against early human habitation and use in this reconstruction.
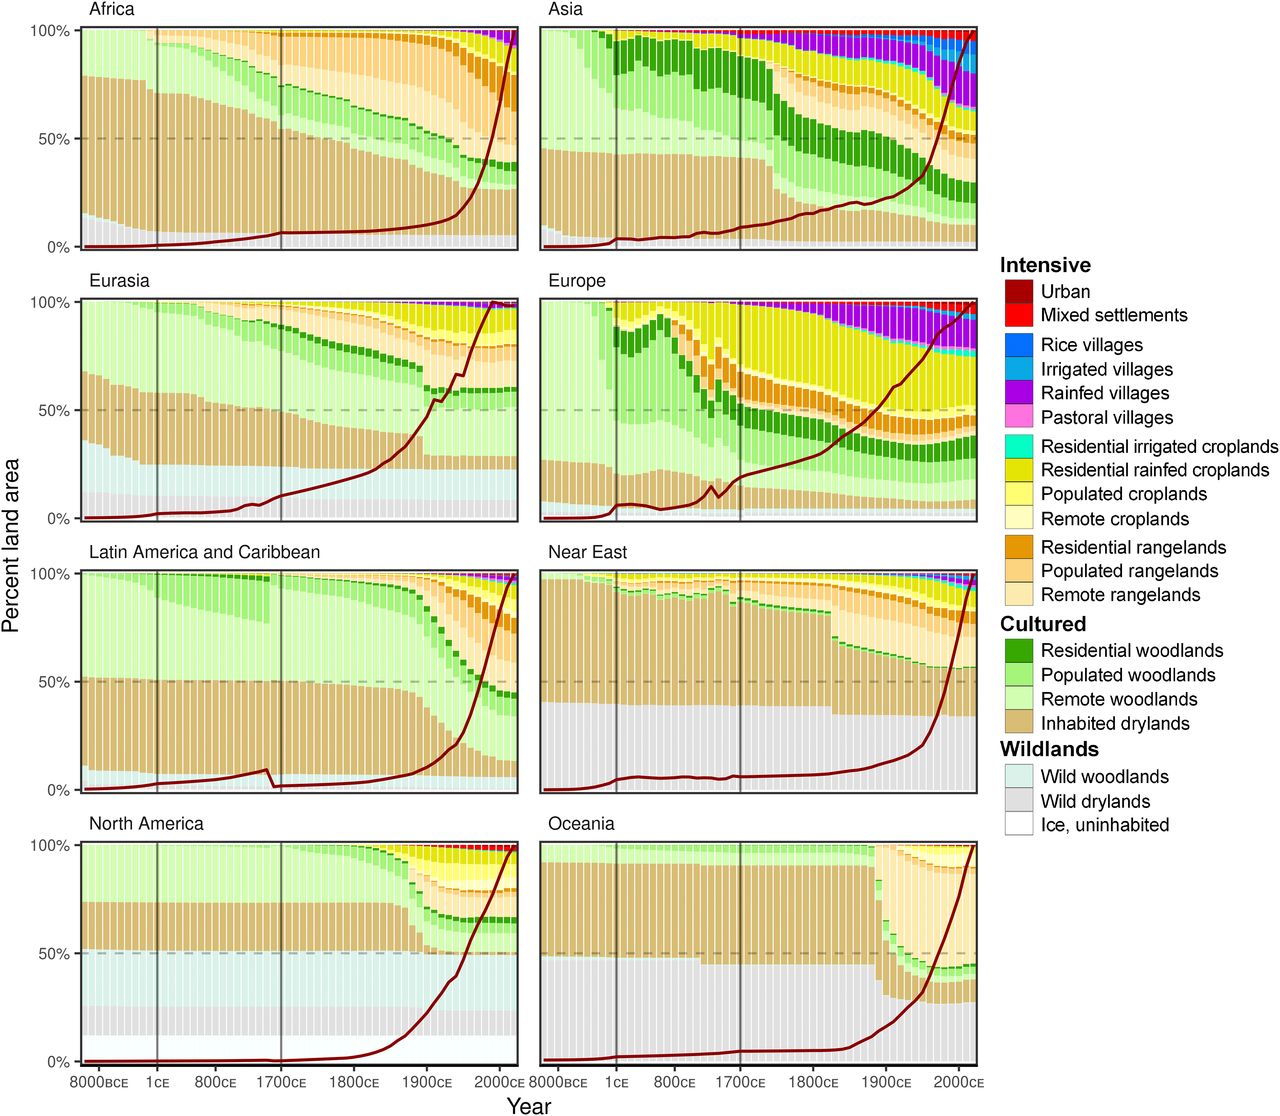
Figure 2. Regional changes in anthromes and populations 10,000 BCE to 2017 CE (regions indicated by lines in Fig. 1A). Regional uncertainties in SI Appendix, Fig. S3.
|
Anthrome trajectories across biomes also show varied histories of anthropogenic change (Fig. 3; uncertainties in SI Appendix, Fig. S4). Some terrestrial biomes were almost completely Cultured even in 10,000 BCE, with only small areas left as uninhabited Wildlands in the temperate woodlands (3.9%), tropical woodlands (9.7%), grasslands and savanna (11.5%), and shrublands (23.3%). Colder and drier biomes included far greater extents of Wildlands in 10,000 BCE, but only tundra was mostly Wildlands (67%) and remained as such in 2017 CE (56.5%). Gradual conversion of Wildlands and Cultured anthromes to Intensive anthromes was apparent across every biome by 2017 CE. The majority of grasslands and savannas (84.2%), shrublands (72.7%), and temperate woodlands (65.3%) were all transformed into Intensive anthromes by 2017 CE. In these biomes, most transformation to Intensive occurred in Cultured anthromes, not Wildlands (Fig. 3).
Natural History Is Human HistoryContemporary patterns of biodiversity-rich areas, areas prioritized for conservation, and those specifically labeled natural all show long and significant histories of human use (Fig. 4A). The historical land use trajectories associated with KBAs resemble those of Earths land as a whole (Fig. 1B versus Fig. 4A), with most KBAs in Cultured anthromes in 10,000 BCE (77%) and only 12% remaining in Wildlands by 2017 CE. Areas mapped as Likely Natural and described as least altered by people and the highest priority for conservation (53) are associated with histories of human habitation and use across most of their area by at least 1 CE. Though Large Wild Areas (3GC) were mostly Wildlands over the past 12,000 y, even these were only about 58% Wildlands in 2017 CE. Current protected areas show even greater association with long-term use, with only 36.4% in uninhabited Wildlands at 10,000 BCE, dropping to 26.4% in 2017 CE when 42.6% was in Cultured and 31% in Intensive anthromes. As with the terrestrial biosphere as a whole, anthropogenic transformation in areas that would later be protected was mostly gradual, reaching 16.5% in Intensive anthromes, half their current area, by 1840 CE.
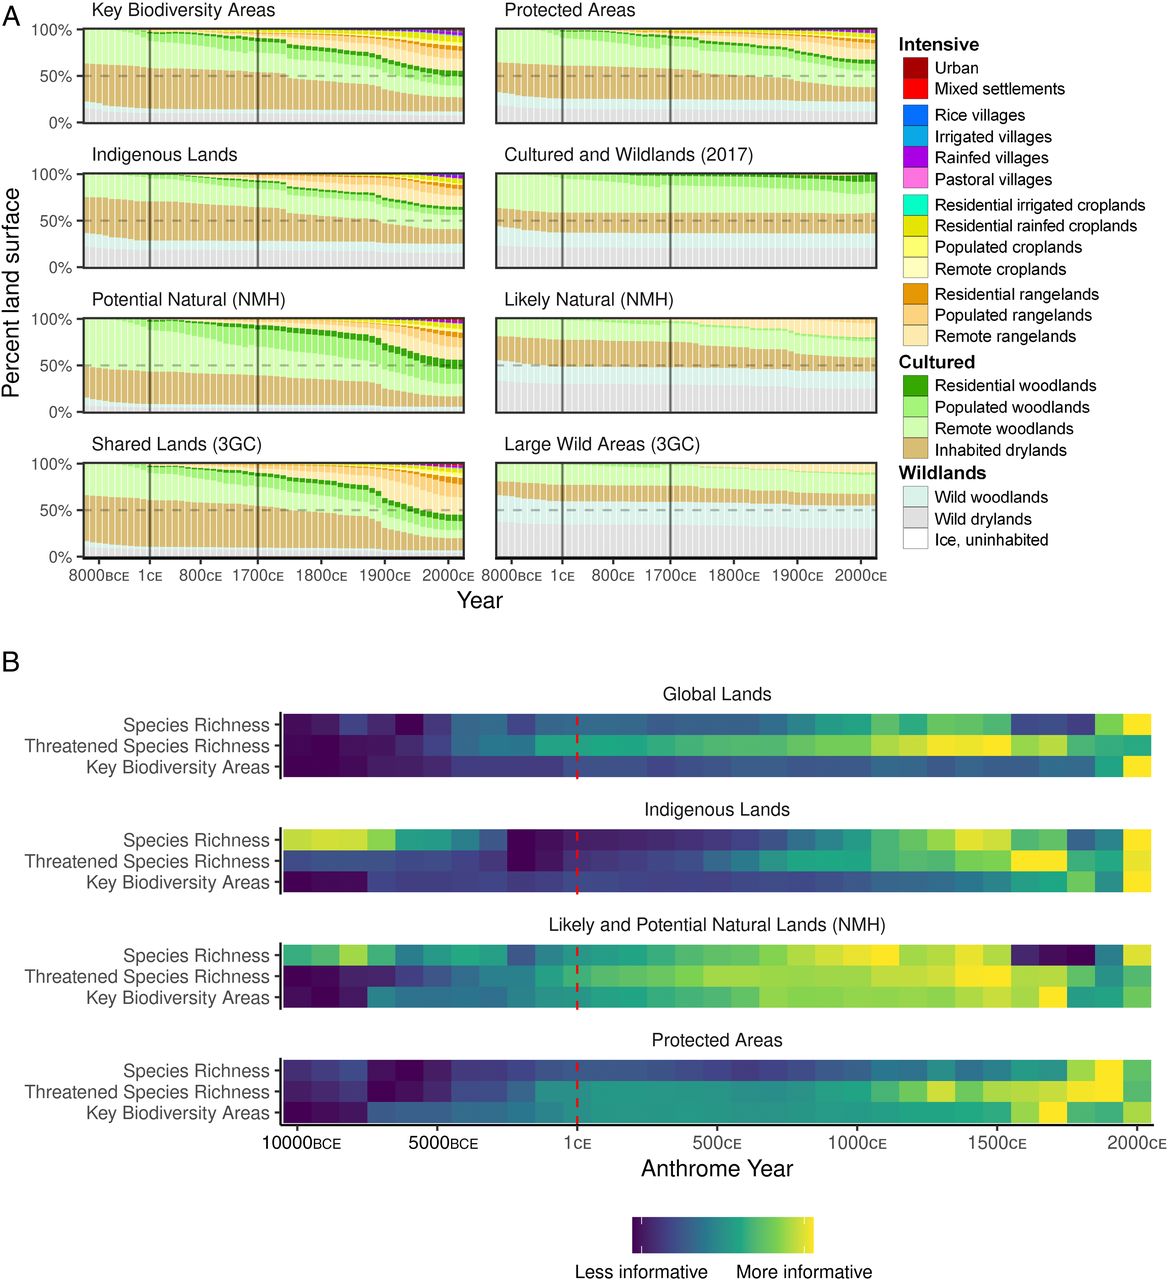
Figure 4. Anthrome histories related to present-day patterns of biodiversity and conservation. (A) Anthrome histories of KBAs (54), Protected Areas, Indigenous land areas (51), regions with Cultured anthromes and Wildlands in 2017, likely natural areas and potential natural areas [NMH (53)], and Shared Lands and Large Wild Areas of the Three Global Conditions [3GC (49)]. (B) Relative performance of past anthrome maps at predicting present-day patterns of biodiversity across all land globally and within the global subset of regional landscapes with >50% of their area covered by Indigenous land areas (51), NMH lands (53), and Protected Areas. Generalized linear models were fit to mean vertebrate species richness and threatened vertebrate species richness (55) per 100 km2 and KBAs using each anthrome map, in turn, as a categorical predictor. The AIC indicates the relative association between anthrome maps at each time step and each contemporary pattern (AIC is only comparable for models fit to the same dataset, so rescaled values are shown here). Red dashed line marks transition from 1,000 y to 100 y time steps.
|
At the global scale, contemporary global patterns of vertebrate species richness and KBAs are significantly associated with current anthrome maps (Fig. 4B). Though prior work has found a positive association between low-intensity land use and biodiversity, especially in Indigenous Peoples lands (51), our data extend this relation to the land use of the past (Fig. 4B). Although historical anthrome patterns were only slightly associated with vertebrate species richness and KBAs at a global scale, their association with threatened vertebrate species richness was greater than with current anthrome patterns (Fig. 4B). Associations between anthrome history and current biodiversity were strongest when viewed within the subset of Earths land characterized as likely or potentially natural (53) (Fig. 4B), but this was also true to some extent for Indigenous lands and protected areas. These patterns and associations differed among regions (SI Appendix, Fig. S6), indicating that distinct regional legacies of past land use are associated with distinct patterns of biodiversity and global conservation priorities. In many cases, this may represent the novel biodiversity patterns of cultural landscapes sustained for millennia and later depopulated or abandoned (60, 61). Taken together, our evidence indicates that the cultural natures of millennia and centuries ago are highly associated with and may have shaped current global patterns of KBAs, vertebrate species richness, and threatened species (Fig. 4B). There is also some indication that after 1500 CE, the strength of this association declines in multiple regions, indicating a potential shift in relations between anthromes and biodiversity following the Columbian Exchange and European colonial expansion. Either way, the current extinction crisis is better explained by the displacement of species-rich cultural natures sustained by past societies than the recent conversion and use of uninhabited Wildlands (17, 22). Decolonizing Natures, Past and PresentIn this study, based on historical global reconstructions of land use and populations, only about 17% of Earths land was without evidence of prior human habitation or use over the past 12,000 y. Yet, even this low percentage is certainly an overestimate, based on growing evidence that the most up-to-date global change models remain biased toward underestimating the importance of early human habitation and land use, especially in areas where seasonal and temporary habitation and use of land predominates (5, 26). Human societies have been shaping and sustaining diverse cultural natures across most of the terrestrial biosphere for more than 12,000 y. Areas under Indigenous management today are recognized as some of the most biodiverse areas remaining on the planet (51, 61), and landscapes under traditional low-intensity use are generally much more biodiverse than those governed by high-intensity agricultural and industrial economies (62, 63). Although some societies practicing low-intensity land use contributed to extinctions in the past, the cultural shaping and use of ecosystems and landscapes is not, in itself, the primary cause of the current extinction crisis, and neither is the conversion of untouched wildlands, which were nearly as rare 10,000 y ago as they are today. The primary cause of declining biodiversity, at least in recent times, is the appropriation, colonization, and intensifying use of lands already inhabited, used, and reshaped by current and prior societies. Depicting human use of nature largely as a recent and negative disturbance of an otherwise human-free natural world is not only incorrect but has profound implications for both science and policy. Across the vast majority of this planet, traditional, Indigenous, and contemporary cultural natures, together with their interwoven peoples and histories, and not areas free from human influence, are essential for understanding and sustaining terrestrial nature, including its biodiversity and contributions to people (2, 24, 47, 49?51, 64). Effective, sustainable, and equitable conservation of biodiversity and natures contributions to people recognizes and empowers Indigenous, traditional, and local peoples and their cultural heritage of sustainable ecosystem management through rights and responsibilities as an essential basis for conservation strategies and priorities around the world (17, 23, 51, 65, 66). Efforts to achieve ambitious global conservation and restoration agendas (11, 15) will not succeed without more explicitly recognizing, embracing, and restoring these deep cultural and societal connections with the biodiversity they aim to sustain. MethodsDGG System.All previous global historical population and land use reconstructions have used 5 arc minute geographic units designed for compatibility with climate models. This use of nonequal area units, which vary from ~85 km2 at the equator to ~10 km2 at the poles, causes biases in global statistical analyses toward Northern latitudes where grid cells are smaller and therefore more numerous per unit land area while also distorting proportional area measures, like those used in anthrome classification, and scale-dependent variables, like species richness. In this study, all data were assessed in an equal area DGG system recently used in policy-relevant global biodiversity assessments to represent regional landscapes across Earths land surface outside Antarctica (49?51) as a set of 1,434,024 equal area hexagons of ~96 km2 [DGG cells; median area = 96.19 km2; Level 12 Icosahedral Snyder Equal Area (ISEA) Aperture 3 Projection (67)]. Raster data in 5 arc minutes and other formats were converted to the DGG system using R [v.3.6.3 (68)] with the packages ddgridR [v.2.0.4 (69)], exactextractr [v.0.4.0 (70)], sf [v.0.95 (71)], and tidyverse [v.1.3.0 (72)]. Anthromes and HYDE 3.2 Data Inputs.Anthrome maps were produced by classifying global maps of human populations and land use from the HYDE 3.2 dataset (48) after conversion to the DGG system. HYDE 3.2 data are provided for 73 time steps between 10,000 BCE to 2017 CE (1,000 y increments from 10,000 BCE to 1 CE, 100 y increments from 100 CE to 1700 CE, 10 y increments from 1710 to 1990 CE, and 1 y increments from 2000 CE to 2017 CE). Annual data for 2000 to 2009 CE and for 2011 to 2016 CE were removed prior to analysis, leaving anthrome, population, and land use datasets at 60 time increments, with decadal resolution from 1700 to 2010 CE and finishing with 2017 CE, the most recent HYDE 3.2 data available. Land areas for each grid cell were also computed from raster data provided in the HYDE 3.2 dataset. Ancillary Variables: Regions, Biomes, Biodiversity, and Conservation.Ramankutty and Foleys potential natural vegetation dataset (73), which combines remotely sensed and modeled inputs, was acquired with the HYDE 3.2 dataset, converted to DGG format, and aggregated from 15 to 8 biome classes. Global maps of NMH land (53) were acquired and converted to DGG format. Additional global variables were acquired in native DGG format from Locke et al. (49), including Olson Biomes [recently updated as the Resolve 2017 biomes (74)], vertebrate species richness (55), the number of vertebrate species threatened with extinction (55), KBAs (54), terrestrial protected areas [World Database of Protected Areas (52) supplemented with data for Chinese protected areas as described in Locke et al. (49)], The Human Footprint [2013 CE; (3)], Indigenous lands (51), the world regions of Ellis et al. (1), and maps of the 3GC (49). Visualization and Statistical Analysis.All spatial and statistical analyses were done in R version 3.6.3 (68). Global-, regional-, and biome-level anthrome area changes over time (anthrome trajectories) were computed and charted based on DGG land areas. For protected areas, KBAs, and other variables that occupied only part of DGG cells, anthrome sums were weighted by the relative areas of each respective variable in each DGG cell. HYDE 3.2 data were also used to compute total populations at the global, regional, and biome levels over time, and these were overlaid on anthrome trajectory charts after scaling them to their maximum value (typically the population in 2017 CE). To examine relationships between anthrome maps and global maps of biodiversity and other ancillary variables, we fitted a series of generalized linear models to each biodiversity pattern using the anthrome maps from a succession of years as categorical predictors. One model was fitted for each anthrome time step from 2000 CE to 1 CE at 100 y intervals and from 1 CE to 10,000 BCE at 1,000 y intervals. We fitted a series of simple categorical models, each representing a single time step, rather than a single complex model across time steps for the sake of interpretability and computational efficiency. Nonnegative integer data (vertebrate species richness and threatened vertebrate species richness) were modeled with a Poisson distribution with a log link, while proportional area data (KBA) were thresholded at 50% cell area to create presence/absence data and modeled as binomial with a logit link (i.e., logistic regression). We calculated the Akaike information criterion (AIC) for each modeled biodiversity variable and time step pair to assess relative differences of in-sample predictive performance (75, 76). Lower AIC values indicate better performance or a closer association between the anthrome maps of a given time step and the global patterns of a given biodiversity variable. The AIC is only comparable for models fitted to the same dataset, so we rescaled the AIC values to a common range of [0, 1] according to the minimum and maximum AIC for each dataset. This rescaling allowed us to visualize the anthrome time steps that best predicted each biodiversity variable. We repeated this analysis for all ice-free land areas (global lands), Indigenous lands, potential and likely natural land areas (NMH classes 3 and 4), protected areas, and for each world region separately. Data AvailabilitySource code to reproduce these analyses and visualizations is available as an R research compendium on the Harvard Dataverse [(77), https://doi.org/10.7910/DVN/6FWPZ9]. Although the entire analysis can be made from the source code using publicly available data, intermediate data products such as the full Level 12 DGG anthrome classification, maps, and summary statistics are available on the Harvard Dataverse [(78), https://doi.org/10.7910/DVN/E3H3AK]. AcknowledgmentsWe thank the editor and three anonymous reviewers for helpful advice that greatly improved this manuscript. N.B. was supported by the Max Planck Society. S.D. has been partly supported by the Newton Fund (Natural Environmental Research Council-UK and CONICET-Argentina), and the Inter-American Institute for Climate Change Research Small Grant Program 090. J.G. was supported by NSF CAREER grant EAR-1753186. J.C.S. was supported by VILLUM FONDEN Investigator grant 16549. David Tryse and Tanya Birch of Google Earth Outreach provided invaluable assistance with online mapping. The research reported in this paper contributes to the Global Land Programme (GLP.earth). FootnotesAuthor contributions: E.C.E. and N.G. designed research; E.C.E., N.G., and K.K.G. performed research; N.G., K.K.G., J.O.K., and C.N.H.M. contributed new reagents/analytic tools; E.C.E., N.G., and K.K.G. analyzed data; and E.C.E., N.G., K.K.G., R.B.B., N.B., S.D., D.Q.F., J.L.G., J.O.K., N.K., H.L., C.N.H.M., D.R., T.C.R., M.R.S., L.S., J.-C.S., and J.E.M.W. wrote the paper. The authors declare no competing interest. This article is a PNAS Direct Submission. This article contains supporting information online at https://www.pnas.org/lookup/suppl/doi:10.1073/pnas.2023483118/-/DCSupplemental.
- Copyright © 2021 the Author(s). Published by PNAS.
|
|
|
|
"Modern agriculture is a means
of turning oil into food."
David Pimentel (1925-2019)
|
|
Page 20
|
|
FREE SUBSCRIPTION
|
![[groups_small]](groups_small.gif)
|
Subscribe to the
Mother Pelican Journal
via the Solidarity-Sustainability Group
Enter your email address:
|
|
|
|


