To achieve sustainability in the USA and generally, it is crucial that we narrow the income gap between the highest and lowest earners. An equitable distribution of income is a prerequisite of social and environmental sustainability. Its not just about sustainability, eitherits about fairness, too.
People tend to be happier and healthier in societies where there is a more equitable distribution of wealth, as well as more likely to receive higher education and have a longer life expectancy.[i] Among the G7 countries, the USA ranks highest in income inequality, and the wealth gap more than doubled between 1989 and 2016 and continues to widen.[ii] The more the income gap widens, the worse it gets for economic mobility.
Sometimes called the Great Gatsby Curve by economists, the relationship between income equality and mobility is such that children from lower-income families will be far less likely to improve their economic status compared to their parents.[iii] It simply seems unfair that so little of the USAs population controls so much of its wealth while 20 percent of Americans are unable to even pay their monthly bills and give their children the opportunity for a better future.
Income Inequality and Its Negative Effects
Domestic and international researchers have explored the effects of income inequality through the Gini coefficient.[iv] The Gini coefficient ranges from 0 to 1, where 0 represents perfect equality and 1 represents perfect inequality. In other words, when the coefficient is 0, everyone receives an equal share; when the coefficient is at 1, only one group or individual gets everything.
The Gini coefficient is not a perfect indicator, as it depends on every country having reliable income data and doesnt measure informal economic activity. However, it does provide useful insights for how income inequality effects peoples wellbeing. For example, one researcher compared infant mortality rates in the USA by mapping CDC data against the Gini Index and found that as income inequality increased, so did infant mortality.[v] Researchers also found that U.S. teenagers living in states with higher levels of inequality are more likely to become pregnant than those living in states with a low level of inequality.[vi]
Gini coefficients have also been analyzed with data from the U.N. Human Development Indicators, revealing that Japan has the lowest Gini coefficient (lowest inequality) and the U.S. has the highest, and that there is a significant relationship between inequality and obesity.[vii]
The pervasive reach of income inequality extends beyond societal impacts. Researchers have also discovered strong threats to the environment and sustainability. While many of the causes of biodiversity loss, such as habitat loss and climate change, are more directly causal, some studies have explored the relationship between income inequality and biodiversity loss. Even after controlling for factors like biophysical conditions, human population size, and per capita GDP and income, researchers found that as the Gini coefficient increased, so did the indicators of biodiversity loss.[viii] This pattern remained the same whether compared across countries or U.S. states. The researchers noted that correlation does not equate to causality, but they postulated a strong likelihood of causality in this case.
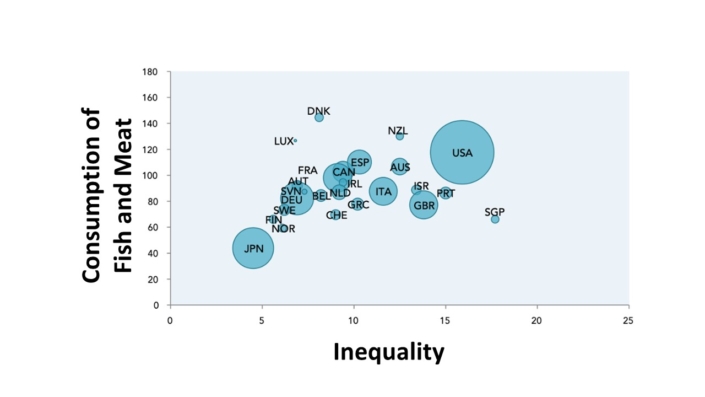
It doesnt end at biodiversity loss either. One researcher found that there was a consistent trend, at least among wealthy countries, whereby those with higher inequality consumed more resources and generated more waste.[ix] U.S. water consumption per capita is more than twice that of Japan. In Japan, the top 10 percent of the population has an income 4.5 times that of the bottom 10 percent. In the U.S., the top 10 percent earns 16 times that of the lowest. Similarly, in New Zealand, where the top 10 percent earn 12.5 times as much, the per capita annual consumption of fish and meat is close to three times as much as that of Japan.
This same pattern is reflected in how much per capita annual waste countries generate. Sweden, which has a relatively low ratio of income inequality, generates 513kg of waste annually. Switzerland, with an income inequality ratio of 9, generates 728kg, and Singapore, where the top 10% earns 18 times as much as the bottom 10%, generates a whopping 1072kg.[x]
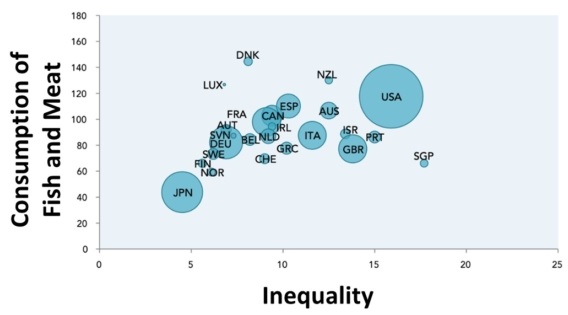
Inequality and consumption of fish and meat across countries, 2002-2007.
Note: Circle size corresponds to the size of a countrys population.[xi]
Salary Caps
One proposed solution to narrow the income gap is to implement a salary cap, which could also be considered a 100 percent tax rate beyond a certain salary. The tax revenue may be repurposed to serve the public good.
Salary caps have been kicked around the policy arena as early as 1933, when members of the House of Representatives were introducing amendments to limit annual incomes to $1 million. In 1942, Franklin Roosevelt proposed that annual incomes should be capped at $25,000 (which would translate to $375,000 today).[xii] These proposals were never legislated, but academics and policymakers have explored the concept with increasing interest and support.
The NFL and NBA, among other athletic organizations, have famously adopted salary caps. Since 1994, the NFL has enforced both a salary floor and cap for its athletes and teams. These minima and maxima are readjusted after annual reviews. Sports teams have found that leveling the playing field not only makes for a more egalitarian league, but it also makes the performance more engaging for their audience as well.[xiii]
It would hardly make sense, though, to set one overarching salary limit across all industries and occupations. Some industries require higher levels of education and more skilled qualifications. Industries that require specialized education and experience will have less competition than other industries and may garner greater profits. Holding industries with a huge disparity in profit margins to the same salary cap doesnt seem feasible. If set too low, the political prospects for establishing the cap would be nil. If set too high, it would lose effectiveness.
In Supply Shock: Economic Growth at the Crossroads and the Steady State Solution, Brian Czech proffers sectoral salary caps of fifteen times the lowest in-sector salary or wage, calling this a common-sense starting point for feasible policy negotiations. Using the example of a barber in Pulaski, Tennessee versus a barber in New York City, it makes sense that the New York barber could, would, and should charge more for a haircut. For producing what would be a $15 haircut in Pulaski, the New York barber may receive up to $450. A $450 haircut is hardly a glowing example of sustainability, yet its not a $1,000 haircut, which would be wantonly wasteful by almost anyones standards. The cap, then, would move us in the direction of sustainable consumption.
The Sustainable Salaries Act
Consistent with Czechs sectoral salary-capping proposal, I propose a Sustainable Salaries Act. The legislation may be included in CASSEs broader Full and Sustainable Employment Act. Alternatively, it may be introduced as an independent bill.
The Sustainable Salaries Act would prohibit top employees in most industries from making more than fifteen times as much as the lowest-paid employees. Somewhat lower proportional caps would apply to sectors known for inequitable business practices or the production of non-essential goods and services.
The bureaucracy entailed may not be as onerous as some would suspect. Companies already report their employees salaries and wages to the IRS. Pursuant to the Sustainable Salaries Act, the IRS will compile this information and submit it to the U.S. Department of Labor. If a company violates the act, it will face criminal penalties and fines in proportion to excess salaries, and CEOs may even face jail time in egregious cases.
The following is a conceivable Section 3 (Declarations) of the Sustainable Salaries Act. This should give readers a better sense of how the law would function and provide a starting point for conversation on sectoral salary capping. As the act is further developed, some of the subsections may be broken out into full sections.
|
Sec. 3. DECLARATIONS
1. In General.The salary of the most highly compensated employees of any
organization or corporation may not be any greater than fifteen times the salary of
the lowest paid employee of the same organization or corporation.
(A) The salary of the most highly compensated employees of any organization or
corporation engaged in activities
(1) in the pharmaceutical and drugs sector, real estate sector, and commercial lending sector may not be any greater than ten times the salary of the lowest paid employee of the same organization or corporation.
(2) in the amusement and recreation sector, cosmetics sector, and jewelry sector may not be greater than twelve times the salary of the lowest paid employee of the same organization or corporation.
2. REPORT.The Internal Revenue Service shall submit the salary and
wage information of all employees within the top ten percent of highly compensated
employees and the salary and wage information of all employees within the lowest ten percent of the least compensated employees within an organization or corporation to the U.S. Department of Labor for review.
3. CRIMINAL PENALTIES.Whoever
(1) knowingly and willfully exceeds the salary limit set forth under the Sustainable
Salaries Act shall be fined under this title or imprisoned for not more than two years
or both.
(2) willfully reports a record of compensation as set forth in the Sustainable
Salaries Act with the intent to deceive, mislead, or otherwise falsely misrepresent
information, knowing that the record contains false information or does not meet all
the requirements set forth in the Act, or both, shall be fined not more than
$5,000,000 or imprisoned not more than ten years, or both.
|
Enforcing salary caps pursuant to a Sustainable Salaries Act is just one step toward a steady state economy, but a crucial one. By reducing income inequality, we move closer to not only a more equitable society, but a more sustainable one as well.
Notes
[i] According to a study in Italy, where the Gini coefficient was mapped against life expectancy at birth, income inequality was shown to have a significant negative correlation with life expectancy. G.A. Cornia, R. Gnesotto, R. Mistry, R. De Vogli. 2005. Has the relation between income inequality and life expectancy disappeared? Evidence from Italy and top industrialised countries. Journal of Epidemiology and Community Health 59(2):158162.
[ii] Schaeffer, K.,6 facts about economic inequality in the U.S, Fact Tank: News in the Numbers, Pew Research Center, February 7, 2020, https://www.pewresearch.org/fact-tank/2020/02/07/6-facts-about-economic-inequality-in-the-u-s/.
[iii] Vandivier, D. What is the Great Gatsby Curve? The White House: President Barack Obama, June 11, 2013, https://obamawhitehouse.archives.gov/blog/2013/06/11/what-great-gatsby-curve.
[iv] Chappelow, J, Gini Index, Investopedia, February 3, 2020, https://www.investopedia.com/terms/g/gini-index.asp.
[v] Erwin, P., M. K. Jones, and A. Siddiqi. 2015. Does higher income inequality adversely influence infant mortality rates? Reconciling descriptive patterns and recent research findings. Social Science & Medicine 131:8288.
[vi] Levine, P.B. and Kearney, M. S. 2012. Why is the teen birth rate in the United States so high and why does it matter? Journal of Economic Perspectives 26(2):141-63.
[vii] Brunner, E., Kelly, S., T. Lobstein, K.E. Pickett, K. E. and R. G. Wilkinson. 2005. Wider income gaps, wider waistbands? An ecological study of obesity and income inequality. Journal of Epidemiology and Community Health 59(8):670-674.
[viii] Gonzalez, A. G.M. Mikkelson, and G.D. Peterson. 2007. Economic inequality predicts biodiversity loss. PLOS ONE 2(5):e444.
[ix] Islam, S. Inequality and Environmental Sustainability. New York: DESA Working Paper No. 45., 2015.
[x] Ibid.
[xi] Ibid.
[xii] Pizzigati, S., For Minimum Decency, a Maximum Wage, Institute for Policy Studies, June 6, 2018, https://ips-dc.org/for-minimum-decency-a-maximum-wage/.
[xiii] Vassallo, J. The Advantages of Salary Caps. Houston Chronicle, July 31, 2020.


![[groups_small]](groups_small.gif)