
|
Mother Pelican
A Journal of Solidarity and Sustainability
Vol. 16, No. 5, May 2020
Luis T. Gutiérrez, Editor
|
|
|
|

|
|
|
Social Dimensions of Fertility Behavior and
Consumption Patterns in the Anthropocene
Scott Barrett, Aisha Dasgupta, Partha Dasgupta, W. Neil Adger,
John Anderies, Jeroen van den Bergh, Caroline Bledsoe, John Bongaarts,
Stephen Carpenter, F. Stuart Chapin III, Anne-Sophie Crépin, Gretchen Daily,
Paul Ehrlich, Carl Folke, Nils Kautsky, Eric F. Lambin, Simon A. Levin,
Karl-Göran Mäler, Rosamond Naylor, Karine Nyborg, Stephen Polasky,
Marten Scheffer, Jason Shogren, Peter Søgaard Jørgensen, Brian Walker,
and James Wilen
Originally published in
Proceedings of the National Academy of Sciences, 24 March 2020
under a Creative Commons License
|
Abstract ~ We consider two aspects of the human enterprise that profoundly affect the global environment: population and consumption. We show that fertility and consumption behavior harbor a class of externalities that have not been much noted in the literature. Both are driven in part by attitudes and preferences that are not egoistic but socially embedded; that is, each households decisions are influenced by the decisions made by others. In a famous paper, Garrett Hardin [G. Hardin, Science 162, 12431248 (1968)] drew attention to overpopulation and concluded that the solution lay in people abandoning the freedom to breed. That human attitudes and practices are socially embedded suggests that it is possible for people to reduce their fertility rates and consumption demands without experiencing a loss in wellbeing. We focus on fertility in sub-Saharan Africa and consumption in the rich world and argue that bottom-up social mechanisms rather than top-down government interventions are better placed to bring about those ecologically desirable changes.
Keywords ~ fertility, consumption, socially embedded preferences
|
The biosphere is the part of Earth that is occupied by living organisms. A useful way to partition it is in terms of interconnected constituents we call ecosystems. Ecosystems combine the abiotic environment with biological communities (plants, animals, fungi, microorganisms) that form self-regenerative functional units. They differ in their spatial reach (a hedgehogs gut is an ecosystem as is a tropical rain forest) and rhythmic time (minutes for bacterial colonies; decades for a boreal forest), but even as an aggregate, the biosphere is a self-regenerative system. Also, like its constituent parts, the biosphere is diminished as a stock, in quality or quantity (or both), when our demand for its goods and services exceeds its ability to supply them on a sustainable basis.The Commons as ExternalitiesBeing in large measure a common property resource, many of the constituent parts of the biosphere are freely available. Moreover, people everywhere are capable of recognizing that a commodity is free. Thus, if population size relative to the cost of harvesting the biosphere is large, then other things equal, people draw excessively on it (1). The tragedy of the commons is a widely used metaphor for the phenomenon (2). Those excessive demands reflect the desires of individual households to convert the biosphere into their own private sources at rates that are higher than the rates they would choose were households to be guided by their collective interest. One expression of that excess is the difference between the discount rates of time that are inferred from our market transactions and the rates people would choose to discount the future were we able to negotiate among ourselves over the demands that we make of the biosphere (3). Thus, estimates of discount rates based exclusively on market data (4, 5) mislead: they are biased upward. Another expression of our excessive demands on the biosphere is procreation, for freedom in the commons provides people with a stimulus to reproduce their numbers, other things equal (3). The stimulus, which may of course be negligible for some communities depending on their social mores, provides a direct link between the commons and aggregate population size. No doubt the demands that each of us makes of the biosphere are small, but when summed across all people and over time, they are substantial. The commons create a social environment that resembles the classic prisoners dilemma in game theory. The excessive demands that we make of the biosphere (which we will also refer to as nature) are a manifestation of externalities, which are the unaccounted consequences for others, including future people, of actions taken by one or more persons. As externalities reflect institutional failure (e.g., the failure of nations to reach agreement on the use of the global commons; the failure of a community to protect its local natural resource base through checks and balances; the failure of a society to award equal power for women and men), the commons can only be rescued by reasoned collective action. It has been customary to study ways to avoid the tragedy of the commons by considering taxes and regulations at the national level (1), communitarian practices at the local level (68), and treaties at the international level (9). The underlying assumption about human behavior in many of those studies has been that people are egoists. Here, we study ways that are based on social norms that arise when people look to the decisions made by others when making their own decisions (1016). For the purposes of managing the commons, there is thus a role not only for governments but also, for communities and civil society. We use the term socially embedded preferences or social preferences for short to identify someones behavior and practices that are influenced by the behavior of others. Two broad classes of social preferences have been found to be empirically significant: competitive and conformist. The former as in the phenomenon of conspicuous consumption [first studied by the sociologist Thorsten Veblen (10) and more recently given wide empirical support in refs. 11 and 12] displays a desire for a high social status relative to that of others. The latter embodies a desire to be like others, meaning that a person prefers to be close to others in their choices rather than be distant from others (13). The former gives rise to a pressure for higher consumption; the latter leans toward conformity. Our behaviors in some spheres of life have been found to be competitive (11, 15); in others, they have been found to be conformist (13, 16), and in still others, they seem to resemble those of the egoist, familiar in economics textbooks. We study the implications of competitive behavior over consumption in the rich world and conformist behavior over reproduction in the worlds poorest countries as templates for understanding the overshoot in demand that humanity has been exercising over the biospheres goods and services in recent decades. We do not claim that behavior is necessarily based on conscious choices. A reviewer has suggested that, in preliterate society, behavior was purely norm based and that basic female education has helped to bring fertility into the calculus of conscious choice, with an attendant reduction in fertility desire. However, conscious choice even in modern societies does not preclude the influence of social norms (17). More importantly for fertility surveys, women selling goods in the marketplace in the poorest countries may be illiterate but are never innumerate. We will make use of the distinction subsequently. Behavior directed by social preferences has externalities built into it. Here, we study the biospheric implications of those externalities. In contrast to competitive social preferences and to the problem of the commons, conformist social preferences give rise to social environments that have the structure of coordination games, possibly possessing multiple stable equilibria, all parties being better off in some than in others (14). Although conformist preferences over reproduction can amplify the tragedy of the commons, they appear in the literature infrequently, perhaps because of concerns about state intervention in what are regarded as personal matters. Social preferences over consumption goods in contrast are mentioned in the media on occasion, but they have not yet entered policy discourse, perhaps because they too are thought to be in the private domain. However, because social preferences give rise to externalities, behavior responding to them should not be regarded as purely personal matters. Moreover, behavior based on such preferences can be shifted by social mechanisms that do not involve state directives but instead, bottom-up social mechanisms. The latter are likely to be better placed to bring about ecologically desirable changes. In this paper, we present a framework for identifying the factors that have contributed to humanitys overshoot in the demand for the biospheres goods and services. We then apply the notion of social preferences to the framework to argue that the social costs of eliminating the overshoot may prove to be far less than is currently feared. The Impact Equation and Unsustainable DevelopmentPopulation size, living standards, and the technologies and institutions in play shape humanitys demand for the biospheres goods and services (18). The composition of the biosphere matters greatly, but here, we simplify by conceptualizing it as a self-organizing regenerative resource measured in, say, tons of biomass. The biospheres primary productivity is the rate at which it regenerates itself. As we are measuring the biosphere in units of biomass, primary productivity is the amount of carbon that is fixed (net of respiration) by autotrophs per unit of time, which for our purposes here, amounts to the net rate at which carbon is fixed from photosynthesis. Primary productivity is the source of energy for all living matter and is a flow. In contrast, the biosphere is a stock and is the locus of the products and services that we extract from it. Humanitys impact on the biosphere per unit of time is called the global ecological footprint. To construct a measure of that impact, let N be human population and y an index of human activity per person per unit of time. Estimating average human activity per person poses huge measurement problems; therefore, for tractability, we suppose that it corresponds to the standard of living as measured by gross domestic product (GDP) per capita. The move almost surely yields an underestimate of what we are after because there are many human activities that are not captured in the market value of all final consumption goods and services in a year. Global GDP is thus a mere proxy for what we are seeking. On occasion, national income statisticians have offered estimates of the magnitude of economic transactions that are missing in GDP, but they are too scanty to be of use here. Degradation of the biosphere can hasten the depreciation of other assets (rising sea level submerges coastal infrastructure, hotter weather lowers labor productivity, and so on). Here, we focus instead on the demand that we make of the biospheres goods and services. That demand takes two broad forms. We harvest natures goods and use natures services for consumption and production. (Fish, timber, and fresh water constitute goods; pollination, water purification, flood protection, and sequestration and storage constitute services.) We also degrade natural capital stocks through overharvest and through overuse as pollution sinks. Let X denote harvest demand and Z denote the demand that we make of the biosphere as a pollution sink. Both are functions of Ny, and therefore, we may write X = X(Ny) and Z = Z(Ny). This way of partitioning the global ecological footprint says that pollution is the reverse of conservation (19). Let aX be a numerical measure of the efficiency with which the biospheres goods and services are converted into GDP, and let aZ be a numerical measure of the extent to which we are able to treat our waste products before discharging them. Therefore, we have X = Ny/aX and Z = Ny/aZ. Humanitys demand from the biosphere in a given year is then (Ny/aX + Ny/aZ). Define a = (aX + aZ)/aXaZ. Then, (Ny/aX + Ny/aZ) = Ny/a is our proxy measure of the global ecological footprint. If the footprint exceeds the biospheres regenerative rate, the stock diminishes. Similarly, if the footprint is less than the biospheres regenerative rate, the stock increases. (Bifurcations leading to regime shifts and irreversibilities can be incorporated into this analysis.) However, population, GDP per capita, or both could increase without making additional demands on the biosphere provided either aX or aZ and thus, a were to increase correspondingly. Improvements in technology (e.g., substituting degradable waste for persistent pollutants; decarbonizing the energy sector) as well as institutions and practices (e.g., establishing protected areas; reducing food waste) and appropriate redistributions of wealth are among the means by which a can be raised. Let G denote the regenerative rate of the biosphere. G depends on the biospheres stock, which we write as S. Thus, G = G(S). The G function can be affected by policy. The application of biotechnology in agriculture is one avenue. Another is ecosystem engineering. A recent experiment in American Samoa, for example, found that transplanted heat-tolerant corals were more likely to survive a bleaching event than less tolerant local corals, enabling quicker recovery of the ecosystem after such an event (20). In the range of stocks we are concerned with here (stocks below the level capable of sustaining a maximum yield), dG/dS > 0. Humanitys ecological footprint does not have to equal the biospheres regenerative rate because the difference would be accommodated by a change in the biospheres stock S. A world rich in healthy ecosystems could, on utilitarian grounds, choose to draw down the biosphere and use the goods and services that it supplies so as to accumulate produced capital and human capital. That is what economic development has come to mean among many thinkers, but the scenario comes in tandem with an overshoot in our demands from the biosphere. The overshoot cannot be maintained indefinitely because our life support system would be threatened. In recent decades, Ny/a has exceeded G, thus drawing down S. Studies of biogeochemical signatures of the past 11,000 y have tracked the human-induced evolution of soil nitrogen and phosphorus in inventories of sediments and ice (21). They have reported that the hockey stick shape that has been found in time series of mean global temperature also characterizes many global biogeochemical signatures over similar timescales: they display a flat trend over millennia until some 250 y ago followed by a slow increase until the middle of the 20th century and then, a sharp rise that continues at a fast rate to this day. We interpret that feature of the time series as a continual and growing rise in Ny/a. Biological extinctions, increases in greenhouse gas concentrations, contamination of marine species with persistent pollutants, nutrient overload in soil and water, and oceanic dead zones are reflections of the biospheric overload, meaning that S has declined, with the attendant reduction in G, which in turn, has increased the gap between Ny/a and G. Because the decline in S would appear to have been dramatic since the middle of the last century, mid-20th century has been proposed as the time that we entered the Anthropocene (21). Crude estimates (22) suggest that the ratio of Ny/a to G(S) is today 1.7. Over the years, a large body of work has found that biodiversity is a major determinant of the biospheres productivity and its ability to withstand stresses and shocks (22, 23). Alarmingly, current extinction rates of species in various orders appear to be 100 to 1,000 times higher than their average rate (about 1 per million species per year) over the past several million years (24, 25). In the last 40 y, there has been a 60% decline on average in the populations of mammals, birds, fish, reptiles, and amphibians, mostly in the tropics (26). Biodiversity loss and climate change are now widely regarded to be the two most significant global environmental problems that we face today. Moreover, each influences the other (27). To the extent that they reinforce one another, policies that curb one can be expected to temper the other. These findings are consistent with macroeconomic data (3). From 1950 to 2019, global GDP per capita increased nearly fivefold from about 3,500 international dollars (i.e., US $3,500 purchasing power parity) to about 17,000 international dollars in 2011 prices, even as population trebled in size (from ~2.5 billion in 1950 to around 7.7 billion in 2019). A nearly 15-fold increase in global economic activity in 70 y, taking place from a base year global GDP per capita that was higher than ever before, may give one hope of a future of perpetual material advancement, but when the economic data are paired with environmental indicators, it would appear that the rise in economic activity has been built on unsustainable foundations. Produced capital and human capital have no doubt increased by many fold, but as a stock of natural capital, the biosphere has shrunk considerably. In the long run, humanitys ecological footprint must equal the biospheres regenerative rate. That equality represents a sustainable state of affairs. The widely discussed United Nations (UN) Sustainable Development Goals (SDGs) set in 2015 were formulated on the assumption that they can be attained, but the background documents did not probe the question whether the goals are sustainable in a world that simultaneously enjoys growth in global GDP. We, therefore, work backward by first identifying a condition the global economys treatment of the biosphere must satisfy if the SDGs are themselves to be sustainable. That condition points to ways in which S can be stabilized. To sustain a value of S requires that the global ecological footprint equals the biospheres regenerative rate: that is,
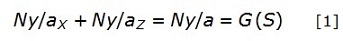
Eq. 1, which we call the Impact Equation, applies to the biosphere as a whole. Although the notion of ecological footprint (the left-hand side of Eq. 1) can be applied to any group of individualsfrom the individual and the household to nations and the global populationtrade in commodities and services breaks the link between demand (Ny/a) and supply [G(S)] for economic units smaller than the world as a whole. The ecological footprint of a nation will not balance the regenerative rate of its ecosystems if its trade in the biospheres goods and services does not balance in units of biomass. Of course, it could be that a country pays for its imports, perhaps even at their appropriate prices, but that is a different matter. Here, we are only formulating a way to break down the global imbalance of demand and supply of those goods and services into imbalances among groups in the global population; we are not discussing fair trade. Decoupling the demands that humanity makes on the biosphere Ny/a in the left-hand side of Eq. 1 also serves to remind us that measures to reduce environmental pollution, Z, can raise our demand for the biospheres products, X = Ny/aX. Solar panels require minerals such as aluminum, cadmium, and zinc. However, obtaining those minerals usually requires destroying forests. The literature on the economics of climate change offers a convenient illustration of the need to move to a world where the Impact Equation is reached. Much of that literature has taken Ny as given under various scenarios or pathways, focusing instead on mitigation: that is, on raising aZ by decarbonizing the economy and removing CO2 from the atmosphere. However, the reason that CO2 concentrations in the atmosphere have increased is not only that mitigation and carbon removal measures have been slow; it is also that growth in both GDP per capita and population have been strong. In this paper, we point to ways for reducing Ny or putting the world onto a more favorable pathway for limiting climate change. Why has aZ not risen more? The reason is a low rate of innovation and investment in nonfossil fuel energy sources and carbon capture and storage technologies. However, these low rates, in turn, have been caused by a persistent and pervasive institutional failure: the failure to achieve collective action in limiting climate change. Despite nearly 30 y of diplomatic effort, the world has been unable to overturn the tragedy of the climate commons. The externalities relating to fertility and consumption have other causes, and they can and should be addressed by other institutions. Doing so will not make up for the failure to address climate change directly, but it will help to keep equilibrium global mean temperature closer to the levels advocated for in international conferences. The variables on the left-hand side of Eq. 1, however, point to proximate causes behind the size of our ecological footprint. As ways to raise aZ have been much discussed in the literature on climate change, we explore factors that influence future N and current and future y. Fertility in Low per Capita Income SettingsThere are two prominent global population projections for the future: one emerging from the International Institute for Applied Systems Analysis (28) and the other from the UN Population Division in ongoing work over the past decades (29). There is little difference in their projections of global population size in 2050, and both project a larger population in 2100 than population today. Therefore, our analysis here is unaffected by differences in the two publications. While the projections in ref. 28 are built primarily on forecasts of womens education and other objectives in the SDGs, including the global standard of living, a multitude of factors is implicit in the UN projections (30). However, because the UN projections of alternative future trajectories, cast in probabilistic terms, are more widely known, we cite them here. The UNs median projection of world population in year 2100 is 10.9 billion, with a 95% certainty range of between 9.4 and 12.7 billion (29). More than three-quarters of the increase from todays 7.7 billion is expected to be in sub-Saharan Africa, where population in 2100 is projected to rise from todays ~1.1 billion to 3.8 billion (Fig. 1). Comprising around 14% of the world's population, the region represents only a bit more than 3% of the world economy. Therefore, sub-Saharan Africa cannot remotely be held responsible for the global environmental problems that we face today. However, attempts to raise incomes there even to the current global average income (~17,000 international dollars) in the face of a near-3 billion rise in numbers will require an increase in the region's annual output from 3.5 trillion international dollars to about 68 trillion international dollars at todays prices. That rise, assuming that it is possible, is likely to have adverse consequences for the region's ecology, contributing to further societal conflicts there and greater attempted population movements both within the region and out of it (31).
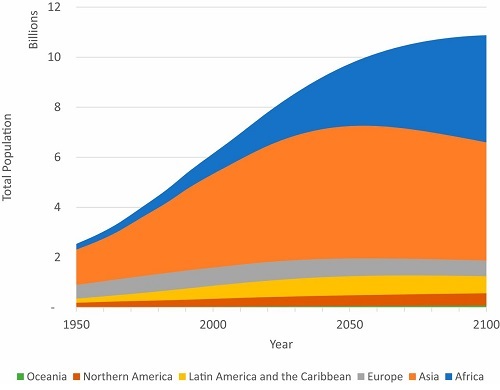
Figure 1. Population, 1950 to 2020; projections 2020 to 2100.
Human population is by region; data are available at
https://population.un.org/wpp/.
The SDGs are reticent about population, and yet, it is difficult to imagine that they can be met without addressing the subject. It has been argued that the goal to restrict the increase in mean global temperature to 2 °C from that in the preindustrial revolution era is unlikely to be met unless population growth is reduced substantially (31), and yet, even the recent Paris Agreement on climate change has made no mention of population. Population in sub-Saharan Africa has risen sharply since the middle of the 20th century because the substantial reductions in the death rate there were not matched by reductions in fertility. Today, women in sub-Saharan Africa have on average around 4.7 births over the course of a lifetime in contrast to a world average of 2.5. The total fertility rate in India has fallen to 2.2, while that in China (at 1.7) is well below replacement level (29). Sub-Saharan Africas slower fertility decline has been traced to many reasons, including inheritance rules, the prevalence of polygamy, lack of access to modern methods of contraception, low education among women, and kinship obligations (3234). Here, we examine a pathway that has been less discussed but that offers an explanation for why the desired number of children should have remained substantially higher in sub-Saharan Africa than elsewhere. The account of the pathway combines history with social mechanisms as seen through the lens of economics. Fertility practices are not only influenced by private desires and wants; they are also shaped by societal mores. Anthropologists have reported that women in sub-Saharan Africa acknowledge that they are able to acquire social status through reproductive success (33). This attitude toward reproduction has been called Children as wealth (35). Using this as a template, we may say that reproductive behavior is conformist when the family size that a household desires is positively related to the average family size in the community or more broadly, in the world that households come into contact with (15). Conformism gives rise to externalities harboring multiple equilibria. As long as all others aim at large families, no household will wish to deviate from the practice; if, however, all other households were to restrict their fertility, every household would wish to restrict its fertility. A society can thus get embedded in a self-sustaining mode of behavior characterized by high fertility and stagnant living standards, even when there is another potentially self-sustaining mode of behavior that is characterized by low fertility and rising living standards, which is preferred by all (14, 15). The structure of social interactions arising from conformist preferences is known as coordination games. Conformist preferences are depicted in a stylized form in Fig. 2. The curve ABCDE is a household's desired number of children plotted against the average number of children per household (the horizontal axis) in the community. The curve is upward sloping and intersects the 45° line from 0 to F at three points (B, C, and D), each of which is a social equilibrium. B and D are stable, while C is unstable. In the figure, which is purely illustrative, every household desires d children if all other households have d children each and b if each among all others have b. Imagine now that every household prefers the outcome in which all households have b children each to the one in which all have d children each. As having either b or d children is a stable equilibrium, a fertility rate of d would be just as tenacious as a fertility rate of b.
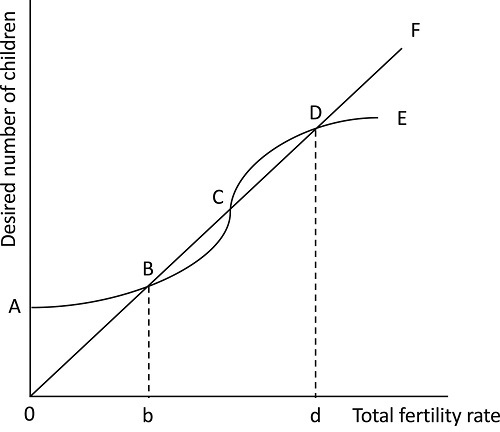
Figure 2. Conformist preferences for children. The vertical axis shows a households desired number of children; the horizontal axis shows the average fertility rate in the society to which this household belongs. The curve from A to E shows the households preferences. The curve from 0 to F shows the 45° line at which the desired number of children equals the average fertility rate. Points B, C, and D represent equilibria. Points B and D are stable; point C is unstable.
|
The theoretical observation that reproductive behavior is guided by conformist preferences [more particularly, that the drivers of such behavior can give rise to multiple reproductive equilibria (14)] was given support in a study of contraceptive use in rural Kenya, which found that, in communities having dense social networks and a poorly developed market economy, a woman would be unlikely to use contraceptive methods if contraception use in her network was low, whereas she would be likely to use such methods if contraception use in her network was high (36). The theory was also given support in an analysis of a natural experiment that found that state-level fertility rates declined in step following staggered introductions of cable television across Indian states in the 1980s (37). Further support has been provided in a recent analysis of contraceptive uptake in Bangladesh (38). The study concerned women living in the same community but belonging to different religious groups. After controlling for individual differences in education, age, wealth, and the like, the study found that a womans choice to use contraception depended strongly on the predominant choice made by other women in her religious group and was unaffected by the predominant choice made by women belonging to the other group. Persistent reproductive practices that go counter to present-day interests may of course have had a rationale in the past. However, even when circumstances have changed, a society can remain stuck in a mode of behavior characterized by high fertility (d) even when there is an alternative that is characterized by low fertility (b), which would be preferred by all. This suboptimal situation disappears when tradition breakers (e.g., more educated women) lead the way to move toward smaller families. Newspapers, radio, television, and the internet communicate information about other lifestyles. The media can be a vehicle by which conformism becomes based on the behavior of a wider population than the local community, which disrupts existing practices. Community discussions on the benefits of smaller family size can coordinate households to act on lowered fertility targets. Economic demographers have interpreted the persistence of high fertility in sub-Saharan Africa to a strong desire for children (39). Conformist preferences point to a different interpretation. Behavior based on such preferences can be expected to display a strong positive correlation between fertility desires and fertility outcomes (as is shown in ref. 39), but causality should not be attributed to the relationship. Conformist preferences tell us that it would be as true to say that fertility rates in a country are high because people there have a strong desire for children as it would be to say that people there have a strong desire to have children because fertility rates are high (15). Fortunately, the transition from d to b children per household does not require coercion, taxation, or even education. A conformist behavior can be shifted by changing expectations about others fertility choices. Family planning programs can be so designed as to encourage members of communities to share information about modern methods of contraception and discuss the advantages of smaller families. As routes to fertility transition, investment in community-based family planning programs should be regarded as essential (40). By providing access to subsidized contraceptive commodities and services, family planning programs were successful in accelerating fertility declines in Asia and Latin America in the 1960s to 1980s. The rationale for vigorously expanding the content and reach of such programs today lies in the 53 million women in sub-Saharan Africa who report that they want to stop or delay childbearing but are not using any modern method of contraception (41). Some use traditional methods; nevertheless, it should not be surprising that 43% of the 206 million pregnancies in developing regions in 2017 were unintended: that is, they occurred too soon or were not wanted at all (42). Many unintended pregnancies end in abortion, a significant proportion of which are performed under unsafe conditions. In addition to reducing unintended pregnancies, contraceptive use among women enhances their own health and that of their children by spacing births and by providing greater opportunity for education. Yet, family planning is a neglected feature of contemporary public policy. Currently, only about 0.6% of overseas development assistance is awarded to it (43). Moreover, developing countries relegate family planning expenditures to minor government departments. Despite evidence that family planning reduces poverty, the World Bank has given low priority to family planning. Although the SDGs include universal access to sexual and reproductive health and emphasize reproductive rights, the family planning indicator that is advanced (SDG indicator 3.7.1) is focused on the satisfaction of the individual woman's expressed desires; it does not value increases in the demand for family planning by community engagement (15). The introduction of family planning-related media messages is credited for part of the rise in contraceptive demand and use in countries where such communication is active. Between 2000 and 2015, the demand for contraception among women of reproductive age rose from 32 to 41% in Ethiopia, from 48 to 60% in Malawi, and from 30 to 44% in Rwanda (41). In contrast, little or no change in demand was observed in countries such as Nigeria and the Democratic Republic of Congo, where family planning programs are weak and continue to be undermined by fragile states and conflict. Moreover, the questions that are directed at women in questionnaires to elicit their fertility desires continue to be ill-formed: They do not ask women what their desired fertility would be were the fertility choices of their peers to change. The acknowledgment that reproductive preferences are socially embedded should be reflected in the questionnaires used to identify womens fertility intentions (15). Consumption by the Rich MinorityThe World Bank (44) has reported that the ~1.2 billion people on its list of high-income countries enjoy a per capita GDP of 46,700 international dollars, implying a GDP of 56 trillion international dollars. World output today is about 120 trillion international dollars. Assuming that our ecological footprint is proportional to the scale of economic activity, close to 50% of humanitys impact ($56 trillion/$120 trillion) on the biosphere can be attributed to some 16% of world population. That is of course the current state of affairs. Output growth in the rest of the world can be expected to make yet further demands on the biosphere. If, as a reasonable aspiration, per capita income in 2100 were 30,000 international dollars at todays prices (a figure close to the average in todays middle income countries) global output at a population of 10.9 billion would be 336 trillion international dollars or nearly three times the current level. The SDGs speak of environmental protection but would not seem to have been influenced by humanitys prospective demands of the biospheres goods and services and of its assimilative capacity. If that demand is to be brought down to sustainable levels, either global output (Ny) will have to decline substantially or technological advances and institutional reforms will have to reduce the environmental impact of high consumption levels (i.e., a will have to be increased). Above, we have explored ways in which growth in N could be reduced. However, as the remedy of reducing y is also typically neglected, we focus on it here. Consumption behavior is influenced both by our urge to compete with others (Veblens conspicuous consumption) and by our innate desire to conform (fads and fashions are only the most striking examples). Building on a wealth of sociological data, Bourdieu (11) has argued that our taste for consumption goods and services is substantially influenced by the tastes of others in our peer group and aspirational groups. Here, we follow that line of inquiry and regard consumption choices as being based on social preferences over a category of goods if the (positive) benefit to an individual of an additional unit of consumption of a commodity in that category increases with the number of people who consume that commodity. To illustrate how an environmentally pernicious category of goods can get established, suppose that there are two categories of consumption goods. Category 1 goods are intensive in the use of the biosphere, whereas the production of category 2 goods is intensive in the use of human capital. If the biosphere was freely accessible, category 1 goods would be cheaper than category 2 goods, other things equal. It is then easy to see why people would have been drawn to category 1 goods in the past and how that would have triggered further demands for category 1 goods, thus fueling an ever-expanding demand for them. Nor would we expect technological advances to be directed at lessening the production costs of category 2 goods. Quite the contrary, competing entrepreneurs would invest in technologies that economize on factor inputs other than natural capital in the production of category 1 goods. Also, that would further fuel the global demand for category 1 goods. Moreover, the greater the difference is between the (market) costs of production of goods in the two categories, the bigger would be the social effort required to move consumers away from category 1 goods to category 2 goods. Difference between the two costs structures would be accentuated by the existence of fixed capital in the sector producing category 1 goods. Retiring machines and equipment before their intended dates can be costly. We are experiencing that phenomenon even as nations try to move away from industries based on fossil fuels. The current structure of market prices works against our common future; the biosphere is precious but priced cheaply. To shift consumption patterns in the rich world and the aspiring consumption patterns of the poor world and those of emerging economies away from resource-intensive goods and services will require massive, coordinated actions. In a different context, economists use the term big push to indicate the investment expenditures and collective determination that are required to move an economy from one equilibrium to another superior one. Fortunately, when social preferences dominate consumption choice, the psychological cost to a person of a collective reduction in consumption is likely to be a lot less than what it would be if she was to reduce consumption unilaterally (15). For example, it has been argued that, as between two societies (one in which everyone owned a large house and had little time for exercising or socializing and another in which everyone owned a modest-sized home but had more time for these other activities), subjective wellbeing would be higher in the second society (45). The point made by the author is that, to the extent that house size is a positional good, people care more about how much they have relative to others than with the absolute size of the house that they live in. By limiting house size, however, resources can be devoted to activities that are known to increase wellbeing. The argument in ref. 45 extends to shifting expenditure away from positional goods toward public goods (45), including a healthier biosphere. Although competitive impulses create a tragedy of the commons as regards positional goods, conformist preferences can create a positive feedback leading to a mutually preferred collective outcome. A study in California shows that an additional installation of solar photovoltaic panels increases the probability of adoption within the same zip code by 0.8%, with the effect being particularly strong at the localized street level (46). Information campaigns also shape behavior. One US study found that electricity customers receiving information about their consumption relative to that of their neighbors reduced energy consumption by 2% (47). Yet another randomized field experiment found that social comparison lowered water consumption by nearly 5% (48). That a move to environmentally friendly behavior would be a gesture toward our descendants is, of course, an added bonus. Social and Technological Transformations to Resolve Population and Consumption DilemmasIn pushing the biosphere deeper into unsustainable territory, the large and growing scale of the human enterprise as reflected in both per capita consumption and population poses a threat to wellbeing worldwide. Improvements in technology and institutions are critical. Conceivably, they can even offset or more than offset the harmful effects of scale. Indeed, changes in technology and institutions have successfully transformed some sectors. By banning chlorofluorocarbons, the Montreal Protocol is expected to restore stratospheric ozone to its pre-1980 level by midcentury. Lead has been phased out of petrol worldwide. Much less oil enters our seas than was the case a few decades ago thanks to changes in tanker design mandated by international agreements. In other areas, including biodiversity loss, degradation of critical ecosystems, and climate change, our collective efforts have not only been less successful; they have failed. For example, calculations by the Secretariat of the UN Framework Convention on Climate Change show that, even if countries fulfill their Paris pledges, CO2 emissions will continue to increase through 2030, virtually guaranteeing that the collective goal of limiting global mean temperature change to well below 2 °C relative to the preindustrial level will be breached. Costs of wind turbines and solar cells have fallen, but there have also been improvements in fossil fuel extraction technology (fracking). Decarbonization of the global energy system is proceeding slowly because institutions like Paris have failed to avert the tragedy of the climate commons. Use of the atmosphere as a repository for CO2 continues to be priced low, even though the social costs of carbon are high. A solution being considered now is to address climate change jointly with income inequality in the form of a domestic green new deal (House Resolution 109, 116th US Congress, 2019). The motivation would seem to be of a political economy nature, but it is as well to ask whether reductions in inequality could be expected to raise or lower emissions, all else being equal. How would income redistribution affect humanitys ecological footprint? To study that, we decompose the aggregate demand that we make of the biospheres goods and services into the demands of various income groups. Let i, j denote households. Households differ according to their incomes yi, yj, and so on, but they differ also as regards the efficiency with which they convert the biospheres goods and services into income. It is conventional to view inequality in terms of the distribution of household incomes, but here, we are interested in the distribution of ecological footprints as well. The latter is reflected in the distribution of the yi/ai. Also, yi and yi/ai are not the same. Without loss of generality, let us label households in terms of increasing income. Therefore, yi < yi+1 for i = 1,
, N. There are strong reasons for thinking that ecological footprint is an increasing function of income, but the matter has been explored mainly for the case of carbon emissions (49, 50). A question of interest is whether the functional relation is convex or concave. Consider an income interval where the function is convex. An egalitarian redistribution of incomes among households in that interval would lead to a smaller global ecological footprint, implying that there is no conflict between income equality and biospheric integrity. However, in a concave interval, the reverse holds: egalitarian redistributions of incomes would lead to larger global ecological footprints, and society would face a cruel choice between income equality and the biospheres integrity (15). There are thus three reasons why we should limit both fertility and per capita GDP. First, institutions and technology have failed to meet the problem of climate change, which implies that limiting our global ecological footprint will prove to be even more difficult unless we are willing to entertain the possibility of limiting Ny. Second, per capita consumption and population are shaped by different institutions than the ones that have kept a low. Addressing these elements of the Impact Equation (Eq. 1) requires social change and not (certainly not exclusively) policy change. Moreover, the appropriate levels for bringing about such change are local and national rather than regional and global, and our institutions are stronger at the local and national levels than at the regional and global levels. Recognition that behavior of people everywhere is in substantial measure socially embedded in ways that are not always apparent to external analysts should give us hope that correcting the social externalities associated with consumption and fertility will improve wellbeing directly and not only by serving to reduce emissions. Data AvailabilityAll data associated with the manuscript are provided within the manuscript.
AcknowledgmentsKenneth J. Arrow participated fully in the meeting in which we discussed the topic of this paper and in follow-up emails, shared with us a few observations, which, I think, have to be taken account of in our paper, all of which, we believe, are incorporated here. He died on February 21, 2017. Our collaboration was supported by the Beijer Institute of Ecological Economics of the Royal Swedish Academy of Sciences. The views expressed herein are entirely those of author A.D. and do not necessarily reflect the views of the UN.
References
-
P. Dasgupta, T. Mitra, G. Sorger, Harvesting the commons. Environ. Resour. Econ. 72, 613636 (2019).
-
G. Hardin, The tragedy of the commons. The population problem has no technical solution; it requires a fundamental extension in morality. Science 162, 12431248 (1968).
-
P. Dasgupta, Time and the Generations: Population Ethics for a Diminishing Planet (Columbia University Press, New York, NY, 2019).
-
W. D. Nordhaus, Managing the Global Commons: The Economics of Climate Change (MIT Press, Cambridge, MA, 1994).
-
W. D. Nordhaus, A review of the Stern Review of the Economics of Climate Change. J. Econ. Lit. 45, 686702 (2007).
-
D. Feeny, F. Berkes, B. J. Mccay, J. M. Acheson, The tragedy of the commons: Twenty-two years later. Hum. Ecol. 18, 119 (1990).
-
E. Ostrom, Governing the Commons: The Evolution of Institutions for Collective Action (Cambridge University Press, Cambridge, UK, 1990).
-
K. Nyborg et al., Social norms as solutions. Science 354, 4243 (2016).
-
S. Barrett, Coordination vs. voluntarism and enforcement in sustaining international environmental cooperation. Proc. Natl. Acad. Sci. U.S.A. 113, 1451514522 (2016).
-
T. Veblen, The Theory of the Leisure Class: An Economic Analysis of Institutions (George Allen & Unwin, London, UK, 1925).
-
P. Bourdieu, Distinction: A Social Critique of the Judgement of Taste (Routledge and Kegan Paul, London, UK, 1984).
-
J. Helliwell, R. Layard, J. Sachs, Eds., World Happiness Report 2013 (Earth Institute, New York, NY, 2013).
-
M. Douglas, B. Isherwood, The World of Goods: Towards an Anthropology of Consumption (Routledge, London, UK, 1979).
-
P. Dasgupta, An Inquiry into Well-Being and Destitution (Clarendon Press, Oxford, UK, 1993).
-
A. Dasgupta, P. Dasgupta, Socially-embedded preferences, environmental externalities, and reproductive rights. Popul. Dev. Rev. 43, 405441 (2017).
-
O. Johansson-Stenman, F. Carlsson, D. Daruvala, Measuring future grandparents preferences for equality and relative standing. Econ. J. (Lond.) 112, 362383 (2002).
-
C. Bledsoe, Contraception and natural fertility in America. Popul. Dev. Rev. 22 (suppl. 1), S297S324 (1996).
-
P. R. Ehrlich, J. P. Holdren, Impact of population growth. Science 171, 12121217 (1971).
FREE Full Text
-
P. Dasgupta, The Control of Resources (Harvard University Press, Cambridge, MA, 1982).
-
M. K. Morikawa, S. R. Palumbi, Using naturally occurring climate resilient corals to construct bleaching-resistant nurseries. Proc. Natl. Acad. Sci. U.S.A. 116, 1058610591 (2019).
-
C. N. Waters et al., The Anthropocene is functionally and stratigraphically distinct from the Holocene. Science 351, aad2622 (2016).
-
M. Wakernagel, B. Beyers, Ecological Footprint: Managing Our Biocapacity Budget (New Society, Gabriola Island, BC, Canada, 2019).
-
D. U. Hooper et al., Effects of biodiversity on ecosystem functioning: A consensus of current knowledge. Ecol. Monogr. Ecological Soc. Am. 75, 335 (2005).
-
D. Tilman, F. Isbell, J. M. Cowles, Biodiversity and ecosystem functioning. Annu. Rev. Ecol. Evol. Syst. 45, 471493 (2014).
-
S. L. Pimm, P. H. Raven, The state of the worlds biodiversity in Biological Extinctions: New Perspectives, P. Dasgupta, P. H. Raven, A. McIvor, Eds. (Cambridge University Press, Cambridge, UK, 2019), pp. 80112.
-
M. Grooten, R. E. A. Almond, Eds., Living Planet Report - 2018: Aiming Higher (World Wildlife Fund, Gland, Switzerland, 2018).
-
T. Lovejoy, L. Hannah, Biodiversity and Climate Change: Transforming the Biosphere (Yale University Press, New Haven, CT, 2019).
-
G. J. Abel, B. Barakat, S. Kc, W. Lutz, Meeting the Sustainable Development Goals leads to lower world population growth. Proc. Natl. Acad. Sci. U.S.A. 113, 1429414299 (2016).
-
United Nations Population Division, World Population Prospects: 2019 Revision (United Nations, New York, NY, 2019).
-
United Nations Population Division, World Population Prospects 2019: Highlights (United Nations, New York, NY, 2019).
-
C. Juma, Game over? Drivers of biodiversity loss in Africa in Biological Extinction: New Perspectives, P. Dasgupta, P. H. Raven, A. McIvor, Eds. (Cambridge University Press, Cambridge, UK, 2019).
-
B. C. ONeill et al., Global demographic trends and future carbon emissions. Proc. Natl. Acad. Sci. U.S.A. 107, 1752117526 (2010).
-
C. Bledsoe, Children are like young bamboo trees: Potentiality and reproduction in sub-Saharan Africa in Population, Economic Development and the Environment, K. Lindahl-Kiessling, H. Landberg, Eds. (Oxford University Press, Oxford, UK, 1994).
-
J. Bongaarts, J. Casterline, Fertility transition: Is sub-Saharan Africa different? Popul. Dev. Rev. 38 (suppl. 1), 153168 (2013).
-
J. I. Guyer, S. M. Eno Belinga, Wealth in people as wealth in knowledge: Accumulation and composition in Equatorial Africa. J. Afr. Hist. 36, 91120 (1995).
-
H.-P. Kohler, J. R. Behrman, S. C. Watkins, The density of social networks and fertility decisions: Evidence from South Nyanza district, Kenya. Demography 38, 4358 (2001).
-
D. T. Jensen, E. Oster, The power of cable TV: Cable television and womens status in India. Q. J. Econ. 124, 10571094 (2009).
-
K. Munshi, J. Myaux, Social norms and the fertility transition. J. Dev. Econ. 80, 138 (2016).
-
L. H. Pritchett, Desired fertility and the impact of population policies. Popul. Dev. Rev. 20, 155 (1994).
-
J. Bongaarts, Can family planning programs reduce high desired family size in Sub-Saharan Africa? Int. Perspect. Sex. Reprod. Health. 37, 209216 (2011).
PubMed
-
United Nations Population Division, Estimates and Projections of Family Planning Indicators 2019 (United Nations, New York, NY, 2019).
-
Guttmacher Institute, Adding It up: The Costs and Benefits of Investing in Sexual and Reproductive Health (Guttmacher Institute, New York, NY, 2017).
-
C. Grollman et al., Donor funding for family planning: Levels and trends between 2003 and 2013. Health Policy Plan. 33, 574582 (2018).
-
World Bank, World Development Indicators (World Bank, Washington, DC, 2017).
-
R. H. Frank, The frame of reference as a public good. Econ. J. (Lond.) 107, 18321847 (1997).
-
B. Bollinger, K. Gillingham, Peer effects in the diffusion of solar photovoltaic panels. Mark. Sci. 31, 900912 (2012).
-
H. Allcott, Social norms and energy conservation. J. Public Econ. 95, 10821095 (2011).
-
P. Ferraro, M. K. Price, Using nonpecuniary strategies to influence behavior: Evidence from a large-scale field experiment. Rev. Econ. Stat. 95, 6473 (2013).
-
R. Schmalensee, T. M. Stoker, R. A. Judson, World carbon dioxide emissions: 1950-2050. Rev. Econ. Stat. 80, 1527 (1998).
-
W. T. Harbaugh, A. Levinson, D. Molloy Wilson, Reexamining the empirical evidence for an environmental kuznets curve. Rev. Econ. Stat. 84, 541551 (2002).
|
ABOUT THE AUTHORS
Scott Barretta ,b , Aisha Dasguptac , Partha Dasguptad ,1 , W. Neil Adgere , John Anderiesf , Jeroen van den Berghg ,h ,i ,j , Caroline Bledsoek , John Bongaartsl , Stephen Carpenterm , F. Stuart Chapin, IIIn , Anne-Sophie Crépino , Gretchen Dailyp , Paul Ehrlichp , Carl Folkeo ,q , Nils Kautskyr , Eric F. Lambins ,t ,u , Simon A. Levinv , Karl-Göran Mälero , Rosamond Naylorw , Karine Nyborgx , Stephen Polaskyy , Marten Schefferz , Jason Shogrenaa , Peter Søgaard Jørgensenq ,bb , Brian Walkercc , and James Wilendd
a School of International and Public Affairs, Columbia University, New York, NY 10027;
b Earth Institute, Columbia University, New York, NY 10027;
c Population Division, Department of Economic and Social Affairs, United Nations, New York, NY 10017;
d Faculty of Economics, Cambridge University, CB3 9DD Cambridge, United Kingdom;
e Geography, College of Life and Environmental Science, University of Exeter, EX4 4RJ Exeter, United Kingdom;
f School of Sustainability, Arizona State University, Tempe, AZ 85287;
g Institute of Environmental Science and Technology, Universitat Autònoma de Barcelona, 08193 Bellaterra, Spain;
h Institució Catalana de Recerca i Estudis Avançats, 08010 Barcelona, Spain;
i School of Business and Economics, Vrije Universiteit Amsterdam, 1081 HV Amsterdam, The Netherlands;
j Institute for Environmental Studies, Vrije Universiteit Amsterdam, 1081 HV Amsterdam, The Netherlands;
k Anthropology Department, Northwestern University, Evanston, IL 60208;
l Population Council, New York, NY 10017;
m Center for Limnology, University of Wisconsin, Madison, WI 53706;
n Institute of Arctic Biology, University of Alaska Fairbanks, Fairbanks, AK 99775;
o Beijer Institute of Ecological Economics, Royal Swedish Academy of Sciences, SE-105 05 Stockholm, Sweden;
p Department of Biological Sciences, Stanford University, Stanford, CA 94305;
q Stockholm Resilience Centre, Stockholm University, SE-106 91 Stockholm, Sweden;
r Department of Systems Ecology, Stockholm University, SE-106 91 Stockholm, Sweden;
s School of Earth, Energy & Environmental Sciences, Stanford University, Stanford, CA 94305;
t Woods Institute for the Environment, Stanford University, Stanford, CA 94305;
u George Lemaître Earth and Climate Research Centre, Earth and Life Institute, Université Catholique de Louvain, 1348 Louvain-la-Neuve, Belgium;
v Department of Ecology and Evolutionary Biology, Princeton University, Princeton, NY 08544;
w Earth System Science, Stanford University, Stanford, CA 94304;
x Department of Economics, University of Oslo, 0317 Oslo, Norway;
y Department of Applied Economics, University of Minnesota, St. Paul, MN 55108;
z Department of Environmental Sciences, Wageningen University, NL-6700 AA Wageningen, The Netherlands;
aa Department of Economics, University of Wyoming, Laramie, WY 82071;
bb Global Economic Dynamics and the Biosphere, Royal Swedish Academy of Sciences, 104 05 Stockholm, Sweden;
cc Land and Water, Commonwealth Scientific and Industrial Research Organisation (CSIRO), Canberra, ACT 2601, Australia;
dd Department of Agricultural and Resource Economics, University of California, Davis, CA 95616.
Edited by B. L. Turner II, Arizona State University, Tempe, AZ, and approved February 12, 2020 (received for review June 14, 2019).
To whom correspondence may be addressed ~ Email: pd10000@cam.ac.uk.
|
|
|
|
|
"Example is Leadership"
Albert Schweitzer 1875-1965
|
|
Page 3
|
|
FREE SUBSCRIPTION
|
![[groups_small]](groups_small.gif)
|
Subscribe to the
Mother Pelican Journal
via the Solidarity-Sustainability Group
Enter your email address:
|
|
|
|


