Introduction The use of models to answer an important question
In the decade of the 2010s, global population increased from 7.0 billion to 7.8 billion and the global economy grew by 30%. This decade also saw murmurings of whether this continued growth was sensible, or even possible, start to reach the mainstream. The global system is built around permanent economic growth, but can planet Earth sustain another centurys worth? Two groups of researchers, spread over 50 years, have turned to computer models to answer the question.
The first computer model with the capability to answer such a question was World3, a system dynamics model described in detail in The Limits to Growth (Meadows et al., 2004). World3 projects the flow of human population, industrial capital, non-renewable resources, agriculture, and pollution to the year 2100. The use of such a model was important because:
1. Computer models have distinct advantages over the mental models that people generally use. A model is a set of assumptions that help us make decisions in an infinitely complex world. A computer model forces us to formalise our assumptions in equations and numbers for critical review and allows us to test the impact of each assumption.
2. It analysed the full scale of the problem - World3 is a system dynamics model that projects the flow of five key variables on a global scale. Whilst most scientists study the world by breaking it up into smaller and smaller pieces, system dynamics modelling encourages a whole and continuous view, striving to see the patterns underlying individual events (MIT, 1997).
3. It created projections 130 years into the future, analysing a scale of time that is rarely considered.

Figure 1. The Limits to Growth ~ A 1972 report on the computer simulation of exponential growth and finite resources
|
Such a model has huge potential and can guide opinions on whether continued economic growth is feasible. However, the results must be taken with a sense of perspective. The model was created at a highly aggregated level; its results represent a likely direction of travel rather than a fixed prediction. Each model is only as good as the assumptions that underpin it and a high number of scenarios must be run to test a realistic range of these assumptions.
The Limits to Growth
The Limits to Growth presented various scenarios from World3, each based on varying social and environmental assumptions. Most of these scenarios projected global industrial output to peak within the 21st century. Industrial decline occurs because increasing capital is drained into either extracting resources, adapting to pollution, producing enough food or developing technologies to offset these physical limits.
World3 only projects a sustainable future when a deliberate constraint is placed upon population and material growth. Limits to Growth argued that society should target a form of equilibrium state, where material consumption no longer grows. The book itself sold over 12 million copies and has been described as the founding text of the modern environmental movement (Jackson and Webster, 2016).
The LTG research raised environmental awareness but ultimately failed to lead to the political actions called for. Critiques of World3 tended to focus on the level of aggregation and political bias within the model. Could we really forego the economic system that has brought human society so much just because of generic and aggregated resource and pollution factors?
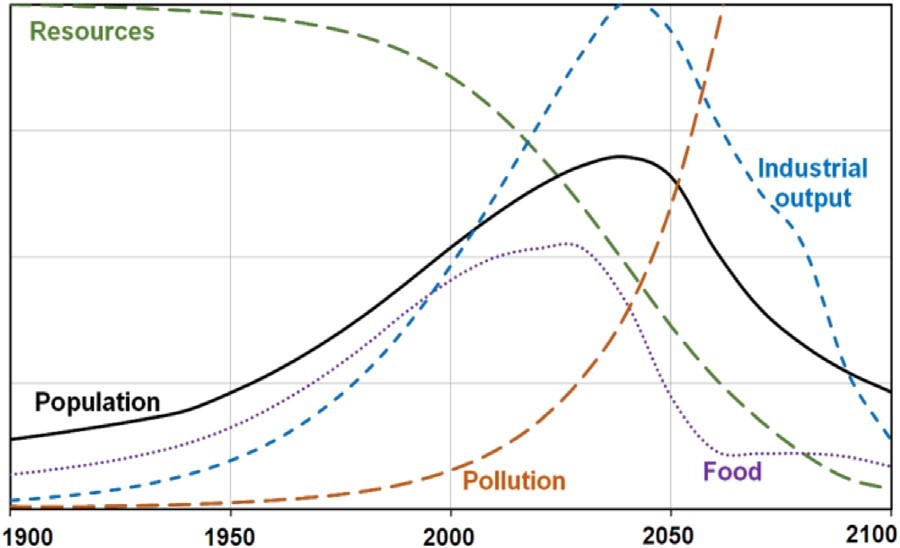
Figure 2. Scenario 2 from the Limits to Growth ~ Global industrial collapse due to increasing pollution costs
|
50 Years on So were they right?
How have the models projections faced up to the test of time? An assessment of events over the last 40 years shows that the major variables of population, industrial output and food production are closely following the LTG business as usual scenario (Turner, 2012). Does that mean collapse is imminent? There is a mixed scorecard on the underlying physical constraints:
Food A steady increase in food production per capita has offset most, but not all, of the increase in demand for food. Between 1970 and 2016, the proportion of the worlds land being used for agriculture grew from 46% to 50% of the worlds habitable land (Ritchie and Roser, 2020).
Resources Between 1970 and 2016, the amount of raw materials extracted from the ground has more than tripled (UNEP, 2016). Despite continued concern about the rapid increase in consumption, there is no evidence that society is about to hit a resource crisis. The cost of raw materials has remained relatively constant with continued technological advances offsetting the diminishing quality of reserves (Yamada and Yoon, 2014; Eastin et al., 2011).
Pollution - Environmental issues have turned out considerably worse than the Club of Rome's projections with concerns that climate change, biodiversity loss, damage to nitrogen cycles and land use could all threaten the maintenance of the Earth system (Jackson and Webster, 2016). Policy attention and social discourse have increasingly shifted emphasis from general growth concerns to climate change (Eastin et al., 2011).
Climate change appears to be the most threatening examples of physical constraints in the modern world. There will be a cost to the global economic system from both climate change impacts and the cost of decarbonising the economy. A more recent paper looked at whether these specific issues had the potential to cause the form of global collapse projected by World3.
The Limits to Growth Redux Climate Change & Energy
An updated version of World3, entitled the World Energy Model (WEM), swapped generic resource and pollution factors for more specific energy resources and climate change factors. WEM is designed to test the impact of different energy production and climate change assumptions on the likelihood of continued economic growth.
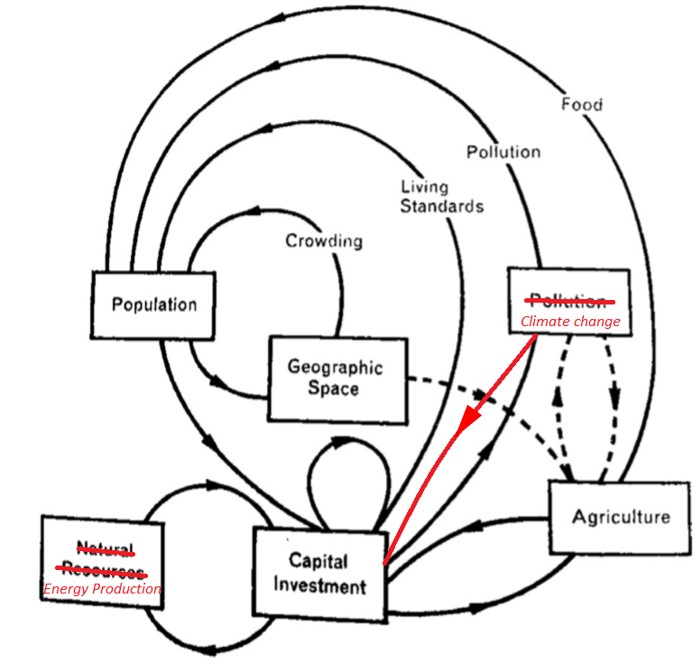
Figure 3. From World3 to WEM ~ Energy Production & Climate Change play a very similar role to the generic resource & pollution factors originally modelled
|
Energy costs are built into the model as a drain on resources, so increasing energy costs reduce the potential for continued economic growth. World3 forecast that resources would become increasingly expensive to extract as the quality of reserves would decrease faster than technology would improve. There is evidence of this impacting energy costs for example, real oil prices are approximately three times higher than the average price through the mid-20th century (BP, 2016). The emergence of renewable energy changes that picture and essentially puts a cap on even the most sceptical forecasts. It is extremely unlikely that energy costs will increase exponentially as World3 projects resource costs might.
Climate change has a more complex relationship to the global system. In order to build the impacts of climate change into such a model, a relationship between industrial output and impacts on other global variables had to be defined.
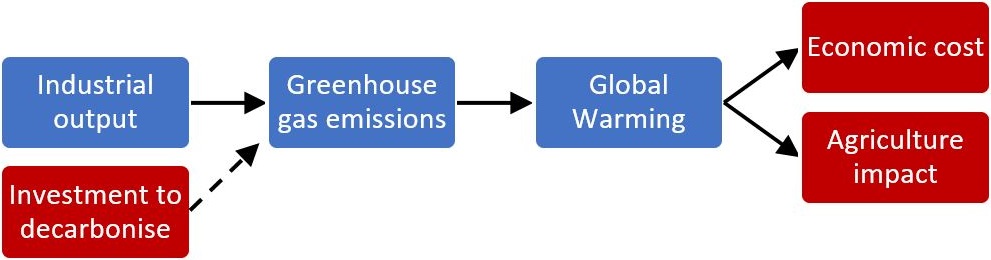
Figure 4. Modelling climate change ~ The final link from a specified warming to global impacts is the most scientifically uncertain
|
WEM models three impacts of climate change:
A direct cost on capital due to the increase in flooding & extreme weather damage (2°C of warming costing 0.3% of global GDP)
A decrease in agricultural yields (2°C of global warming reducing yields by 4%)
A cost to decarbonise economic growth in the form of investments into energy efficiency & a permanent increase in the cost of energy production.
The aggregated nature of the model makes it diffcult to convey the true level of damage caused by climate change. Climate change will affect some people and some countries far more drastically than others. Impacts will generally be greater in developing countries, where climates are typically warmer, and this disparity will lead to global social issues, such as mass migration. These issues are not considered within WEM. Biodiversity loss is another example of a major social concern which is difficult to link back to a global economic cost.
What did the new model say?
The World Energy Model projected:
Increasing energy costs and climate change would stall economic growth in this century. The industrial decline projected in the original Limits to Growth report is offset due to more optimistic technology assumptions and because renewable energy caps the maximum price of energy.
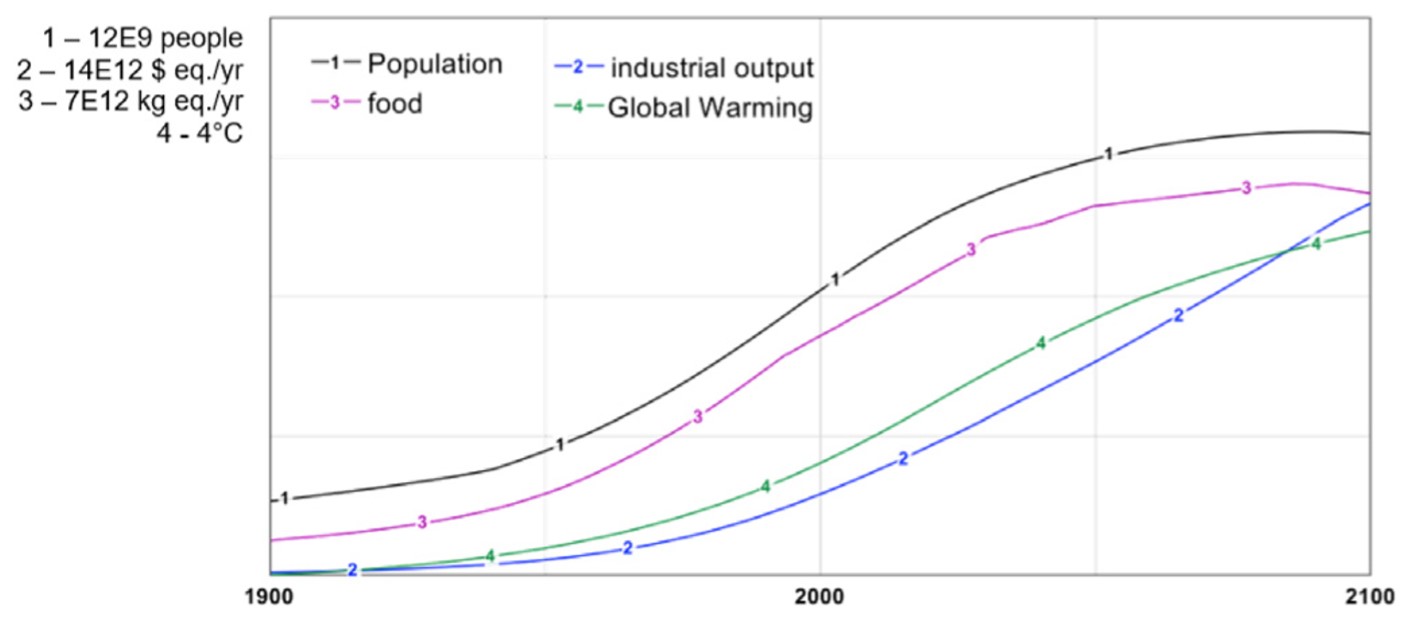
Figure 5. WEM Scenario 2 ~ Steady Economic Growth to 2100, based on current climate change policies
|
Increasing efforts to decarbonise the economy has a short-term cost and a long-term benefit. The impacts of climate change increase over time as the world gets hotter and so there is a delay before society sees the benefits of decarbonisation. WEM forecasts that reducing global warming from 2.5°C to 2°C reduces the annual growth rate between 2020 and 2100 by 0.1-0.2% but increases economic growth in the early 22nd century. These projections are based on a series of uncertain assumptions and further work is needed to define the likely pay-back time of decarbonisation investments. Fundamentally, society must choose between the long-term benefits of limiting potentially irreversible climate change and a short-term cost to material wealth.
Industrial decline is projected in the early 22nd century if the impacts of climate change or population growth is increased. The pessimistic assumptions tested are not unrealistic given the uncertainty in both these areas; for example, industrial decline due to high population growth occurs with growth rates lower than the UNs 80th percentile forecast.
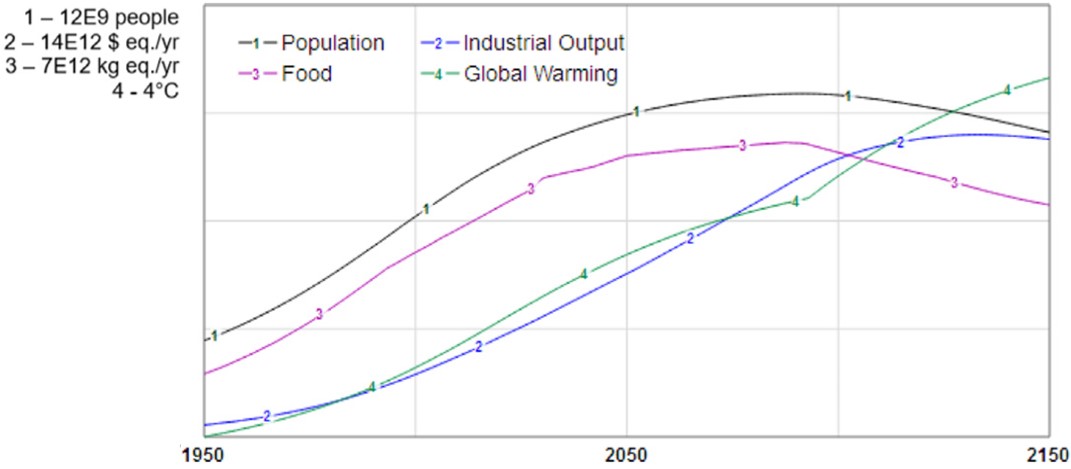
Figure 6. WEM Scenario 5 ~ Pessimistic climate change assumptions lead to industrial decline by 2150
|
What can these models tell us?
The projection of each system dynamics model reflects the assumptions and the political bias that are built into it. The model from The Limits to Growth projected industrial decline would likely occur within the 21st century. An adapted World Energy Model suggested that economic growth would be stalled by climate change costs but is unlikely to collapse; decline is projected in the 22nd century for increased climate change or population growth cases. The two models give no clear answer to the question of whether economic growth is likely for another century but clearly suggest that infinite material growth on our finite planet is biophysically impossible. Both studies support the need for:
Acknowledgement of the role that physical limits will have on future economic growth and continued investigation into the sustainability of economic growth.
Actions to mitigate the risks of climate change and population growth. Population growth plays a key role on both material standards of living and environmental sustainability. There are proven solutions (such as greater funding for education, healthcare and voluntary access to family planning services across less developed countries) and yet it is an ethically difficult issue because of this focus on less developed countries.
The need for a more global and long-term outlook to address these issues.
A data driven approach, supported by the increasing use of models, to prioritise global solutions.
References
Alexandratos, N., Bruinsma, J. 2012. World agriculture towards 2030/2050. Available at
Ansell, T., Cayser, S. 2018. Limits to Growth Redux: A System Dynamics Model for Assessing Energy and Climate Change Constraints to Global Growth, Energy Policy, Volume 120, pp. 514-525.
BP, 2016. BP Statistical Review of World Energy. Available at http://www.bp.com/ statisticalreview.
Eastin, J., Grundmann, R., Prakash, A., 2011. The two limits debates: limits to Growth and climate change. Futures, 43 (1), 1626.
Jackson, T., Webster, R., 2016. Limits Revisited A Review of the Limits to Growth Debate. All Party Parliamentary Group on Limits to Growth.
Meadows, D.L., Meadows, D.H., Randers, J., 1972. The Limits to Growth. Universe Books, New York.
MIT, 1997. MIT SDEP: What is System Dynamics? Available at
Ritchie H., Roser M. (2020) - "Land Use". Published online at OurWorldInData.org. Retrieved from: 'https://ourworldindata.org/land-use' [Online Resource]
Turner, G.M., 2012. On the cusp of global collapse? Updated comparison of the limits to growth with historical data. Gaia 21.2, 116124.
UNEP (2016). Global Material Flows and Resource Productivity. An Assessment Study of the UNEP International Resource Panel. Retrieved from https://www.resourcepanel.org/global-material-flows-database [Online Resource]
Yamada, H., Yoon, G., 2014. When Grilli and Yang meet Prebisch and Singer: piecewise linear trends in primary commodity prices. J. Int. Money Finance. 42, 193207.
|
ABOUT THE AUTHOR
Thomas Ansell studied Mechanical Engineering at the University of Bath and focussed on system dynamics during his Masters. He now works for an operational consultancy and continues his independent research.
|


![[groups_small]](groups_small.gif)