
|
Mother Pelican
A Journal of Solidarity and Sustainability
Vol. 14, No. 5, May 2018
Luis T. Gutiérrez, Editor
|
|
|
|

|
|
|
The Sower's Way: Quantifying the Narrowing
Net-energy Pathways to a Global Energy Transition
Sgouris Sgouridis, Denes Csala, and Ugo Bardi
This article was originally published in
Environmental Research Letters, Volume 11, Number 9, 7 September 2017
Under a Creative Commons License
Planning the appropriate renewable energy (RE) installation rate should balance two partially contradictory objectives: substituting fossil fuels fast enough to stave-off the worst consequences of climate change while maintaining a sufficient net energy flow to support the world's economy. The upfront energy invested in constructing a RE infrastructure subtracts from the net energy available for societal energy needs, a fact typically neglected in energy projections. Modeling feasible energy transition pathways to provide different net energy levels we find that they are critically dependent on the fossil fuel emissions cap and phase-out profile and on the characteristic energy return on energy invested of the RE technologies. The easiest pathway requires installation of RE plants to accelerate from 0.12 TWp yr1 in 2013 to peak between 7.3 and 11.6 TWp yr1 in the late 2030s, for an early or a late fossil-fuel phase-out respectively in order for emissions to stay within the recommended CO2 budget.
|
BackgroundThe 21st Conference of the Parties (COP21) has highlighted the need for a rapid transition away from fossil fuels in order to maintain the emissions of greenhouse gases below a level considered to have an acceptable probability of being safe, leading to a temperature increase not greater than 2 °C or even 1.5 °C. While the goal is clear and ambitious, the methods for attaining it are not. The nationally determined contributions submitted prior to the conference are insufficient to maintain emissions under the target level and the current mainstream scenarios presented rely on, controversial, late century negative emissions (Anderson 2015a, 2015b). In addition to the need of reducing greenhouse emissions, a second fundamental target that is implicit in the COP21 agreement is that these reductions should be obtained while offering sufficient available energy for humankind, especially for developing countries that are ascending the energy availability ladder. As a tool to assist planning towards a sustainable energy transition (SET), we develop a net-energy based model that precisely quantifies the energy transition trajectory, i.e. the rates at which society should install renewable energy (RE) in purely physical terms. In these terms, the desired RE installation rate, is fully determined by four factors: the net energy demand over time, the carbon emissions limits, the profile of the fossil fuel phase-out, and the RE technology characteristicsespecially the value and form of its energy return on energy invested (ERoEI). By avoiding the complications and implicit assumptions of economic-driven models, we exhaustively map a wide-range of possible transition trajectories and assess their relative desirability. The trajectory selected as desirable can then serve as a clear mechanism for setting RE energy policy targets. SET implies the development of a new energy paradigm to cover all the energetic needs of human societies, relying on RE and supported by a more efficient infrastructure for its storage, transmission and use. A physical frame for SET could be stated as: the rate at which society should deploy alternative energy resources over time in order to deliver a desired level of net available energy for a given phase-out profile of the fossil resources. Such an approach offers the following advantages: (i) it is transparent as it removes the veiling complications of prices, costs, climate damage function estimations and projected economic energy intensity, (ii) it provides unambiguous results that can be used for energy system planning and benchmarking, and (iii) it accounts for the energy and resource investment required for a transition implementation putting crucial emphasis on the technologies' energetic costs and their ability to scale in a way that is not obscured by monetary economics assumptions. Despite their large number, all Integrated Assessment Models (IAM) use monetary economics for cost optimization when meeting emissions constraints either as bottom-up or as general or partial equilibrium economic models. Bottom-up approaches start with an estimate of the cost of RE technologies and summing up the costs in various scenarios of gradual substitution that can satisfy the established limits to emissions also used by (Jacobson and Delucchi 2011). These assessments run into difficulties relying on economic models from forecasting the long-term prices of energy resources in a market economy to assuming equilibrium dynamics (Rosen and Guenther 2015) and do not account for the crucial issue of the availability of physical resources necessary for the construction of the new infrastructure in terms of energy and materials referred to as 'energy cannibalism' by (Pearce 2008). On the other hand, market equilibrium models rely on constant elasticity of substitution functions that are ill-suited to model complete technological transitions. As a result, forecasts based on economics tend to be biased by contemporary conditions and misjudge 'surprises' (Craig et al 2002) leading to consistent underestimation of RE deployment by past forecasts that carries on unabated. For example, a typical low representative concentration pathway (RCP), overwhelmingly relies on biomass, nuclear, negative emissions from carbon capture and storage (CCS) along with energy efficiency (van Vuuren et al 2007, 2011) overstating the potential of these options to scale and underestimating their relative costs against RE. A further problem in these assessments are the variable, and sometimes unrealistic, assumptions about the possibility of maintaining economic growth assuming an unrealistic dissociation between the energy and the economic systems (Steckel et al 2013). Physics-based approaches present an alternative by offering a simpler frame focusing entirely on the physical requirements to meet a desired energy level per capita under constraints. Nevertheless, physical approaches can be overly simplistic. A prior approach identified discrete efficiency and energy measures, 'wedges', that produce equivalent emissions reductions and stacked them cumulatively (Pacala 2004, Davis et al 2013). While useful in breaking down the emissions problem making it tractable and 'mind-sized', it did not account for the depletion profile of fossil fuels and also overlooked the energy investment for constructing the wedges that is subtracted from the gross energy flows becoming unavailable for alternate productive uses. Providing sufficient RE to support all global energy needs to make fossil fuel use redundant and strand the right amount of reserves also provides an alternative to the climate-economy trade-off mentality. A physical SET viewpoint refocuses from the economics of carbon mitigation to the energetics of a planned energy substitution process. The physical perspective retains economic implications by recognizing the tight correlation of economic output and energy availability (Brown et al 2011) (see figure S1) and by considering the energetic costs of extracting and delivering useful energy carriers from energy resources as measures of their comparative merit. A fundamental advantage of physical SET is that it acknowledges 'energy cannibalism', i.e. accounting for the energy necessary to build the substitute infrastructure and power the transition. As the transition progresses, fossil fuels are replaced by RE to the point that the energy system relies 100% on the latter. The transition is therefore determined by the rate of RE installations that can substitute the fossil fuel contraction but also by the energy investment needed to support this rate as defined by the energy return on energy investment (ERoEI alternatively EROI Brandt and Dale 2011) of the technologies available for harvesting the alternative resources (Lambert et al 2014) (see SI section 1). While conventional energy statistics track gross energy, the crucial metric for sustaining socio-economic metabolism is net energy, the energy made available from a resource after subtracting the energy expended in its extraction, upgrade and distribution (Huettner 1976, Carbajales-Dale et al 2014). When the ERoEI is large and the investment is operational i.e. concurrent with the energy harvesting, like in fossil fuels and biomass, the net or gross distinction is of limited consequence (Pickard 2014) because in this case the net energy availability is very close to the gross output and time synchronized. It becomes critical though when ERoEI is lower, the investment is capital intensive, as in the case of technical RE like wind or solar, and the rate of installation is high (Dale and Benson 2013). In this case the front-loaded energy investment noticeably reduces net energy availability. The decreasing quality of the fossil fuel resources, as a depleting stock requires additional energy for extraction and refining (Hall et al 2014). To account for these dynamic effects, we build a global energy-balance model (NETSET) that we use to map the potential transition trajectories against a clear definition for what constitutes a SET of all primary energy sources. We develop these models around the reasoned assumption that alternative options including CCS from fossil fuels, nuclear, hydro and bioenergy have limited scale-up potential (see SI section 2). The following sections define SET, introduce the physical global energy transition modeling framework (NETSET), and present the key results of a mapping exercise for the available transition pathways. To respond to what is the appropriate rate and schedule to make the energy transition sustainable we need to define the sustainability of the transition. We refine three normative statements or guidelines drawing from resource economics, (Daly 1996), (Hartwick 1977) presented previously (Sgouridis and Csala 2014) and discussed in the SI section 3: I. The impacts from energy use during SET should not exceed the long-run ecosystem carrying and assimilation capacity II. Per capita net available energy should remain above a level that satisfies societal needs at any point during SET and without disruptive discontinuities in its rate of change III. The rate of investment in building RE harvesting and utilization capital stock should be sufficient to create a sustainable energy supply basis without exhausting the non-renewable safely recoverable resources.
Such bounding implies that SET depends on three critical parameters: the rate at which fossil fuels can be safely combusted, the net energy society requires to function and its tolerance to its change, and the characteristic EROEI of the substitute RE infrastructure portfolio. Planning an energy supply system that transitions from fossil fuels to RE while meeting net energy targets (SI equation (4)) forms a dynamic problem because, as discussed in the background section, current RE investments subtract from the available energy today and shape future energy availability. NETSET as a physical energy-balance model bridges the constraints articulated by the first two sustainability statements with the stock-flow dynamics of the third allowing us to map the space of SET-compliant energy system trajectories (SI section 4). Fundamentally, the rate of change of installed capacity of an energy resource should cover the rate of change in energy demand, end-of life retirement of older equipment, and the investment necessary for building future expansions (SI equation (5)). For RE, this means that they should cover the gap between the demand and the supply from non-scalable resources and the fossil-fuel withdrawal (SI equation (6)) critically factoring in the additional supply of energy necessary to expand the energy system in the future through back-casting (SI equation (7)) and any improvements possible due to the learning curve (SI equation (3)). In this calculation, the ERoEI, operational lifetime of RE, and resource quality availability are central. Once estimated, annual RE installation rate becomes a simple but defining parameter of the transition that serves as a clear measure for planning purposes. In order to derive the constraints related to the first guideline, we focus on GHG emissions. While the long-run carrying capacity is a broader theme affecting both fossil and RE sources, fossil emissions are presently the limiting factor compared to RE impacts (SI section 3). The IPCC reports a probabilistic carbon emissions cap with uncertainty stemming from different climatic models. We investigate the implications of the minimum, average and maximum levels that may restrict warming to below 2 °C (510, 990, 1505 Gt CO2 respectively) (IPCC 2014). These provide a cumulative limit which can, in turn, be met by the different fossil fuel phase-out strategies shown in figure S2: an early peak and gentler phase-out slope, a substitution of more carbon-intensive fossil fuels (e.g. coal) with less intensive ones (e.g. natural gas), or a delayed peak that forces a very steep phase-out afterwards. Similarly, future energy demand depends on assumptions for the energy intensity of the economy and the infrastructure needed to store and use RE, but also on the level of convergence between developed and developing economies. Even the large resource base offered by renewable resources cannot provide an infinitely growing supply of energy (Ayres 1996). Therefore, all our scenarios assume an eventual stabilization of desired energy per person. In terms of gross average power per capita, estimates range from a low 1400 W (Jacobson and Delucchi 2011), 2000 W as a lower limit for a high-income society (Marechal et al 2005), up to 10 000 W (Pickard 2014, Trainer 2014). A study of a deep, yet still partial decarbonization, for the state of California modeled the transition from 6570 W/person in 2010 to 3800 W/person by 2050 with aggressive energy efficiency (Williams 2012) but without accounting for energy embodied in imported goods or the energy used to build the RE infrastructure. Figure S3 shows the range of potential demand trajectories we investigate. As a note on semantics, we express all primary energy use in power terms based on Watts (W) (SI equations (4)(9)). When translating this into installed nameplate capacity through capacity factors, we use Watts peak (Wp) (equation (9)). The primary contributions of this work, are: (i) a detailed, net-energy based model that can quantify any global net energy transition trajectory while capturing the upfront energy investments necessary, (ii) a map of possible transition trajectories that result from a combination of a range of final demand and composite ERoEI of the RE system, and (iii) a relative valuation index of the difficulty of a given trajectory. The first contribution provides a tool to plan the transition when the ERoEIs of individual technology options are known while the second offer insights of how do the transition trajectories vary depending on key assumptions and the third highlights the easier trajectories. The results section showcases the methodology for developing detailed transition trajectories for any set of assumptions on net primary energy requirements, fossil fuel phase-out strategy, and the RE portfolio ERoEI. Given the inherent uncertainties, any such trajectory is but a cross-section of a larger transition landscape. We map this landscape of SET trajectories for a range of: demand, ERoEI, fossil-fuel phase-out strategies (early peak, switch to natural gas, and late peak), as they all significantly impact the required RE installation rates. Nevertheless, each trajectory represents a combination of options that pose different challenge to society. For example, a higher per capita available energy makes it easier for society to prosper than a lower one and therefore is more desirable (Brown et al 2011). Similarly, RE with higher ERoEI values is more difficult to deploy than with lower ones as are trajectories that require investment of a higher fraction of the gross energy than those with lower. Finally, a transition that draws more energy from the gross available either in the form of a high peak or a high average is costlier to society in terms of resource expenditure. Since these four parameters are conflicting in their desirable range, we define and estimate a transition feasibility index (TFI) for each trajectory. TFI is a composite measure of how 'easy' one trajectory is for society to achieve relative to all others. It relates the ease with the ERoEI, net energy demand, and the peak and average intensity of RE installations that form the basis of each trajectory (SI section 5). Figure 1 shows an example of a possible SET trajectory that presents the details of all constitutive energy resources for a 2000 W net energy per capita demand by 2100 and an initial weighted-average RE ERoEI of 20. The RE energy investment magnitude (the principal component of the difference between gross and net energy) is evident as the notable hump above the net energy demand shown as the dashed line in figure 1(a) during the transition acceleration phase (20202060), highlighting the role of fossil fuels as 'seed' of the transition. Figures 1(b) and (c) respectively show the RE installed capacity and installation rate. Figure S4 provides a close-up comparison of the historical capacity additions compared to the model results and the change of the composite ERoEI for this scenario. Figure S5 shows another trajectory that is more constrained and less smooth forced by lower initial ERoEI assumptions (10) and the lowest carbon cap.
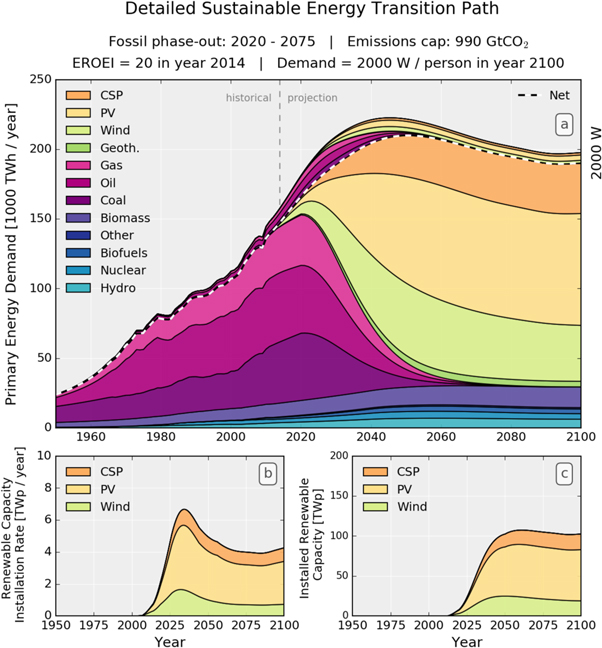
Figure 1. (a) SET-compliant primary energy supply evolution (in PWh) for providing 2000 W average net power per capita by 2100 to a population of 10.8 billion. Fossil fuel emissions comply with a 990 Gt CO2 cap peaking in 2020 and phased-out by 2075. The dashed line represents the net available energy while the values above it the energy investment in building and operating the energy system ('seed'). (b) RE portfolio installation rate profile (in TWp yr1). (c) Installed RE capacity (in TWp).
Given the wide possible range in both the ERoEI of the RE supply and the net demand for energy, we compile the SET-compliant trajectories of RE installation rates and capacity into contour maps to illustrate the impact of these parameters on the RE trajectories. The isolines of figure S6 and S7 show the required RE installed capacity for the range of power demand profiles in figure S3(b) and a wide range for scalable RE ERoEI (6.760) respectively under the three fossil fuel caps and the three fossil phase-out schemes. Each horizontal cross-section (traced as a constant y-axis value in figures S6 and S7) represents the RE installed capacity in a SET-compliant RE trajectory and the slope of the contours represents the net capacity addition rate. The actual installation rate, mapped in figures S8 and S9, is larger as it accounts for the replacement of decommissioned RE installations. In terms of year to year capacity expansion rates, this implies that the historic peak growth rates of cumulative installed capacity (at >30%) should continue until 2020 (see figures S10 and S11) independent of trajectory and then, as the installed base grows, slow down differentially but not substantially remaining >10% until after 2030. When adjusted for TFI, the fairly wide distribution of transition trajectories narrows significantly as the more feasible SETs form a thin band that gets narrower and harder as the fossil-fuel phase-out is delayed. The five-year delay in initiating the transition reduces the TFI (of the figure 1 trajectory) by 22% while a 50% cut in the emissions cap reduces its TFI by 43%. To make relative evaluation easier, figure 2 plots in profile the SET-compliant RE installation rates in TWp yr1 for all combinations of ERoEI and final demand trajectory colored by their relative TFI value. A lower ERoEI pushes higher installation rates earlier by several years in response to the increased upfront investment. Nevertheless, in the critical initial acceleration phase, capacity additions are more influenced by the emissions cap and fossil phase-out. Looking at the best TFI trajectory for the 990Gt CO2 cap (comparing the bold lines in figures 2(d) and (f)), the choice of a late fossil fuel phase-out increases the peak installation rate by 60% peaking at 7.3 in 2035 instead of 11.6 TWp yr1 in 2038. Another indication of the severe impact of the delay is that the peak occurs only eight years after the start of the transition effort versus 15 years in the early phase-out scenario. This implies an increase from the 2015 RE installations that were around 0.12 TWp yr1 by a factor ranging from 60 to 97. While this result is dependent on the TFI specification method, we note that across all scenarios with demand less than 3000 W/person, such delay implies at least a 50% increase in the peak installation rate. The early and fuel-switch phase out profiles offer a wider range of easier paths than the delayed transitions primarily because of their lower investment peaks. Crucially, the lower 510Gt CO2 cap offers little slack creating a very narrow and difficult SET trajectory range that is penalized by the consistently high peak installation rate of around 10 TWp yr1 even for early action. Although, if these peaks are reached then the rest of the trajectory becomes feasible.
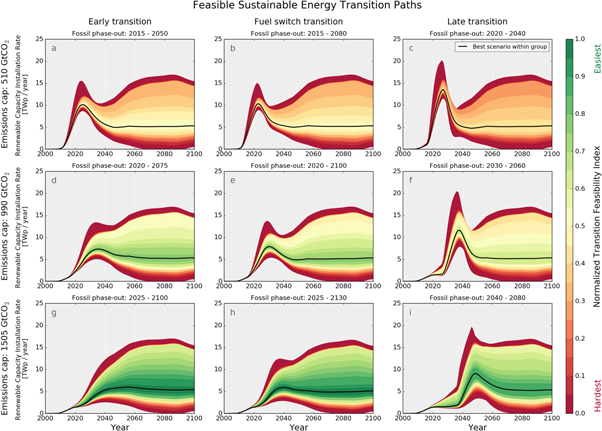
Figure 2. Envelopes of SET-compliant RE installation rates over the RE composite ERoEI range of 6.67 to 60 (in 2014) and a per capita net power demand range of 6676000 W/person (in 2100), under early, early/partial and late fossil fuel phase-out strategies and for three fossil emission caps: 510 (a)(c), 990 (d)(f), and 1505 (g)(i) Gt CO2. The transition feasibility index is a normalized composite measure of the relative difficulty of each trajectory. The solid lines draw the highest TFI (most feasible) trajectory in each group.
Discussion In every case, the trajectory of a successful SET consists of a sustained acceleration in the rate of investment in RE. For the 990Gt cap and the 2000 W demand trajectory, it implies sustaining the RE capacity growth rates at around 30% yr1 until 2020 and then gradually slowing them down to 10% yr1 in 2030 and towards steady state around 2050 (see figure S10). In all cases, the installation rates should increase by several orders of magnitude within the next three decades. Our results significantly diverge from the findings in the IAMs literature relying on outdated cost assumptions where the median estimate from 149 models is that wind and PV generation will be around 25% of the electricity, not primary energy, supply in the low emissions scenarios with a max estimate of around 70% (e.g. see figure 4 in Edenhofer et al 2013). A peak in installation rates, but not cumulative capacity, forms at the point where the energy demand growth starts to slow down. Transition trajectories that have a lower peak are harder as they assume an economy that can operate at the lowest energy per capita or very high ERoEI values for RE. A fuel switch strategy helps in the second half of the century as it lowers the capacity installed but not so much at the acceleration phase from 2015 to 2035 (compare figures 2(b), (e), (h) against (a), (d), (g)). Importantly, further delays in the rise of RE investments cannot be compensated by subsequent additional acceleration because the decline in net energy from the carbon-constrained fossil fuels would be insufficient to power the transition without energetically impoverishing society or exceeding the carbon cap if the carbon cap is the average expected or lower as indicated by the very low TFI throughout the entire range in figures 2(c) and (f). These transition patterns may seem aggressive but they are in line with the time progression of past energy transitions. Although those transitions were partial, they typically were completed within several decades (Fouquet 2010). However, a SET should encompass the entire energy system while providing sufficient net energy to sustain the global economy. Therefore attaining SET depends not only on RE installation but also on replacing a large part of the present energy-utilizing infrastructure (from industrial machines and vehicles to buildings and roads) to match the new energy resources. While present infrastructure systems are adapted to specific energy carriers, for instance liquid fuels for transportation, the technologies available for SET provide electricity, a high quality energy carrier. Replacing the relatively low fossil fuel final energy conversion efficiency would imply that an RE-based, electrified economy should require lower levels of per capita primary energy for the same economic output. Since our methodology focuses on primary energy supply an objection can be raised that lower levels of primary energy are realistically needed. We address this argument by mapping the SET trajectories for a wide range of primary energy demand per capita that includes values lower than even the most optimistic estimate (see discussion in the methodology section). We also note the need for oversizing an RE-based energy system that runs counter to the increasing efficiency of electrification which is discussed below. In SET, societies can adapt by means of restructuring their productive infrastructure and, if not possible, to use electricity to produce synthetic fuels. For instance, modern agriculture relies on fossil resources for mechanization and for the production of critical fertilizers. Nevertheless, it is technically possible to transform the agricultural infrastructure from one using liquid fuels to one that uses electricity to a significant extent (Bardi et al 2013). In other cases, e.g. in aviation, synthetic drop-in fuels can be produced, but with large associated conversion losses. Results from network analysis indicate that future societal energy intensity is likely to be higher if expected urbanization trends materialize (Jarvis et al 2015) supporting the historical connections of social complexity and energy use (Tainter 2011). In summary, done on a global scale, an RE-based energy system should employ (i) certain overcapacity to reduce the impacts of daily resource variability, (ii) mechanical, electro-chemical and chemical storage (Lewis and Nocera 2006) for grid stability, seasonal variability, and as synthetic energy-dense fuels, and (iii) replacement, modification and expansion of infrastructure systems to support rising incomes in the developing world and in order to make them compatible with RE supplye.g. electrification of transportation systems and long-distance electricity transmission. While we have provisioned an ERoEI derating to account for storage needs as detailed in SI section 2.1, our estimates still rely on average annual power and they are most likely conservative for a given trajectory as actual installed RE power would need to be higher to capture demand peaks and especially seasonal variations reducing system efficiency and adding to the energy investment required. On the question of policy, given that there are significant lead times and many infrastructure investment decisions taken today have useful lives and impacts of several decades (Davis et al 2010), their construction needs to account for SET already. Policy mechanisms should be in place to commit to appropriate RE targets and prioritize the allocation of economic resources from other activities to meet them. Such long-term planning requires government direction towards specific but technology-agnostic RE deployment targets. A critical aspect aiding such decisions is that the targets themselves become a factor in driving the economic competitiveness of the RE alternatives. Markets though are useful in deciding on the allocation between technologies. Since economic activities require energy to provide material wealth, real economic growth is reliant on a corresponding increase in the quality-adjusted energy supply (Ayres et al 2003). This has implications for a financial system in which debt is extended relying on the expectation that future growth will permit its repayment; it cannot stay solvent without securing an adequate energy supply to support the expected future economic energy intensity. We therefore propose a corollary, normative economic statement for SET on par with the physical ones: financial commitments of future consumption (debt) should be limited by future energy availability. Tying debt extension to RE investment itself could provide a self-regulating incentive to the financial system to actively pursue the energy transition (Sgouridis 2014). Since SET requires energy to construct the necessary RE infrastructure and to integrate the mostly variable RE resources in the energy system and since at present the world's energy derives primarily from fossil resources, we need the energy from fossil fuels to transition away from their use. This requirement is analogous to 'the sower's strategy' (Bardi 2014b), the long-established farming practice to save a fraction of the current year's harvest as seeds for the next. Fossil fuels are finite but we can 'sow' what these fuels provide: energy and minerals to create the capital needed for the transition (Bardi 2014a). Our work is unique in providing a net-energy based modeling framework for physically quantifying the energy transition and reconciling it with the fossil fuel phase-out dictated by climate constraints. An energy metabolism perspective simplifies a notable confusion in the discussion of RE potentials (Verbruggen et al 2009) as it can provide a range for the RE investment effort (the 'seed') and objectively inform policy formation by back-casting on the appropriate SET trajectory for any desired net energy availability. Given the uncertainties in some of the critical parameters, through a mapping of a range of possible trajectories we show that the growth rates of RE installed capacity should continue unabated at above 30% yr1 until at least 2020 and then slowly ease but still remain above 10% almost until 2030. In terms of absolute installation rates, this acceleration implies an increase from 0.12TW yr1 in 2015 to 7.3TW yr1 by 2035 (or a factor of 60) in RE installation rate if we are to stay on the least difficult compromise trajectory. This is robust across trajectories in early and fuel switch transitions but delays in picking up pace may lead to rates that exceed current by a factor of 95 and more, making them rather impractical. The challenge of a SET before the end of the 21st century under climate constraints is unprecedented in magnitude, scope, and ambition. It is, nonetheless, doable if we adopt a global 'sower's strategy' and proactively invest an appropriate amount of the fossil energy available today into building a sustainable energy future with concrete annual targets. In this respect, the currently observed deceleration in RE deployment (28% growth rate for PV in 2015 from a peak of 75% in 2011 and 17% for wind from a peak of 24.5% in 2010) begins to diverge from early transition trajectories and should be redressed. We would like to thank Masdar Institute and University of Florence for supporting this research. Several colleagues have provided feedback to previous iterations of this text. We would like to specifically thank Michael Dale, Marco Raugei, Steve Griffiths, Scott Kennedy, Antonio Garcia-Olivares, Iyad Rahwan, Alvaro Lopez Pena for their detailed comments. In addition, the perceptive comments and suggestions of the anonymous reviewers have substantially advanced the clarity and detail presented in the final version of our paper.
References
Anderson K 2015a Duality in climate science Nat. Geosci. 8 898900Crossref Anderson K 2015b Talks in the city of light generate more heat Nature 528 437Crossref Ayres R U 1996 Limits to the growth paradigm Ecol. Econ. 19 11734Crossref Ayres R U, Ayres L W and Warr B 2003 Exergy, power and work in the US economy, 19001998 Energy 28 21973Crossref Bardi U 2014a Extracted: How the Quest for Mineral Wealth is Plundering the Planet (White River Junction, VT: Chelsea Green Publishing) Bardi U 2014b The sowers strategy: a way to speed up the energy transition Disrupting the Future ed W Visser (London: Kaleidoscope Futures) pp 12 Bardi U, Asmar E T and Lavacchi A 2013 Turning electricity into food: the role of renewable energy in the future of agriculture J. Cleaner Prod. 53 22431Crossref Brandt A R and Dale M 2011 A general mathematical framework for calculating systems-scale efficiency of energy extraction and conversion: energy return on investment (EROI) and other energy return ratios Energies 4 121145Crossref Brown J H et al 2011 Energetic limits to economic growth BioScience 61 1926Crossref Carbajales-Dale M, Barnhart C J, Brandt A R and Benson S M 2014 A better currency for investing in a sustainable future Nat. Clim. Change 4 5247Crossref Craig P P, Gadgil A and Koomey J G 2002 What can history teach us? a retrospective examination of long-term energy forecasts for the United States Annu. Rev. Energy. Environ. 27 83118Crossref Dale M and Benson S M 2013 Energy balance of the global photovoltaic (PV) industryis the PV industry a net electricity producer? Environ. Sci. Technol. 47 34829Crossref Daly H E 1996 Beyond Growth (Boston, MA: Beacon) Davis S J, Caldeira K and Matthews H D 2010 Future CO2 emissions and climate change from existing energy infrastructure Science 329 13303Crossref Davis S J, Cao L, Caldeira K and Hoffert M I 2013 Rethinking wedges Environ. Res. Lett. 8 011001IOPscience Edenhofer O, Hirth L, Knopf B, Pahle M, Schlömer S, Schmid E and Ueckerdt F 2013 Energy economics Energy Econ. 40 S1223Crossref Fouquet R 2010 The slow search for solutions: lessons from historical energy transitions by sector and service Energy Policy 38 658696Crossref Hall C A S, Lambert J G and Balogh S B 2014 EROI of different fuels and the implications for society Energy Policy 64 14152Crossref Hartwick J M 1977 Intergenerational equity and the investing of rents from exhaustible resources Am. Econ. Rev. 67 9724 Huettner D A 1976 Net energy analysis: an economic assessment Science 192 1014Crossref IPCC 2014 Climate Change 2013: The Physical Science Basis (Cambridge: Cambridge University Press) Jacobson M Z and Delucchi M A 2011 Providing all global energy with wind, water, and solar power: I. Technologies, energy resources, quantities and areas of infrastructure, and materials Energy Policy 39 115469Crossref Jarvis A, Jarvis S and Hewitt N 2015 Resource acquisition, distribution and end-use efficiencies and the growth of industrial society Earth Syst. Dyn 6 689702Crossref Lambert J G, Hall C A S, Balogh S, Gupta A and Arnold M 2014 Energy, EROI and quality of life Energy Policy 64 15367Crossref Lewis N S and Nocera D G 2006 Powering the planet: chemical challenges in solar energy utilization Proc. Natl Acad. Sci. 103 1572935Crossref Marechal F, Favrat D and Jochem E 2005 Energy in the perspective of the sustainable development: the 2000 W society challenge Resour. Conservation Recycling 44 24562Crossref Pacala S 2004 Stabilization wedges: solving the climate problem for the next 50 years with current technologies Science 305 96872Crossref Pearce J M 2008 Thermodynamic limitations to nuclear energy deployment as a greenhouse gas mitigation technology Int. J. Nucl. Governance 2 11330Crossref Pickard W F 2014 Energy return on energy invested (EROI): a quintessential but possibly inadequate metric for sustainability in a solar-powered world? (point of view) Proc. IEEE 102 111822Crossref Rosen R A and Guenther E 2015 The economics of mitigating climate change: what can we know? Technol. Forecast. Soc. Change 91 93106Crossref Sgouridis S 2014 Defusing the energy trap: the potential of energy-denominated currencies to facilitate a sustainable energy transition Front. Energy Res. 2 8Crossref Sgouridis S and Csala D 2014 A framework for defining sustainable energy transitions: principles, dynamics, and implications Sustainability 6 260122Crossref Steckel J C, Brecha R J, Jakob M, Strefler J and Luderer G 2013 Development without energy? assessing future scenarios of energy consumption in developing countries Ecol. Econ. 90 5367Crossref Tainter J A 2011 Energy, complexity, and sustainability: a historical perspective Environ. Innov. Soc. Transit. 1 8995Crossref Trainer T 2014 Some inconvenient theses Energy Policy 64 16874Crossref van Vuuren D P, Elzen den M G J, Lucas P L, Eickhout B, Strengers B J, van Ruijven B, Wonink S and van Houdt R 2007 Stabilizing greenhouse gas concentrations at low levels: an assessment of reduction strategies and costs Clim. Change 81 11959Crossref van Vuuren D P et al 2011 RCP2.6: exploring the possibility to keep global mean temperature increase below 2 °C Clim. Change 109 95116Crossref Verbruggen A, Fischedick M, Moomaw W, Weir T, Nadaï A, Nilsson L J, Nyboer J and Sathaye J 2009 Renewable energy costs, potentials, barriers: conceptual issues Energy Policy 38 85061Crossref Williams J H 2012 The technology path to deep greenhouse gas emissions cuts by 2050: the pivotal role of electricity Science 335 539Crossref
|
ABOUT THE AUTHORS
Sgouris Sgouridis and Denes Csala are with the Department of Engineering Systems and Management, Masdar Institute of Science and Technology, United Arab Emirates. Ugo Bardi is at the University of Florence, Department of Earth Sciences, C/o Dipartimento di Chimica, Polo Scientifico di Sesto Fiorentino, I-50019, Florence, Italy.
|
|Back to Title|
LINK TO THE CURRENT ISSUE
LINK TO THE HOME PAGE
|
|
|
|
"It is error only, and not truth,
that shrinks from inquiry."
Thomas Paine (1737-1809)
|
|
Page 19
|
|
FREE SUBSCRIPTION
|
![[groups_small]](groups_small.gif)
|
Subscribe to the
Mother Pelican Journal
via the Solidarity-Sustainability Group
Enter your email address:
|
|
|
|
