The following article is the final piece in Gioietta Kuos three-part series surveying the worlds diminishing resources. Kuo explains:
The world is at present witnessing an accelerating pace of our use of its precious resources, which have existed over the past millions of years. The main reasons are twofold:
1) The pressure of human encroachment for the gain of agriculture, food and infrastructure required by the growing human population.
2) The effect of the forever increasing global warming year by year, which is both a cause and consequence of diminishing resources.
Next, Kuo turns to the troubling trends in melting ice sheets and rising sea levels.
In February 2018, NASA published the latest data from their most recent extensive satellite results on the accelerating melting of the worlds largest ice sheets: Greenland and Antarctic. Why should we be so concerned about it? It is because their melting is the main contributor to global sea level rise. The average global sea levels is already 82 mm above the 1993 average and is continuing to rise at the rate of around 3 mm/year. In addition to the ice melting the sea level rises because of the thermal expansion of yearly warming seas due to climate change. As both effects show no sign of abating, they pose an increasing existential threat to the worlds coastal cities. In the US, 40% of population lives in relatively high population density coastal areas, where sea level affects flooding, shoreline erosion and hazards from storms. According to UN Atlas of the Oceans, 8 of the worlds 10 largest cities are near a coast. Notably this includes the metropolitan areas of New York, London and Shanghai.
Melting Ice
The largest ice covers on our planet are in Antarctic and Greenland. With the relentless increase in global temperatures year by year, these are melting very fast.
Greenland
In Greenland, ice occupies 1.7 million sq km or about 82% of the islands surface, and exceeds 3 kilometers at its thickest point. If it melted completely it would cause sea levels to rise by 7.2 meters. Based on extensive data from NASA, including satellite, drones and ice bores of the ice sheets bottom layers, it has been found that the ice sheet has shed on average more than 303 gigatons ( billion metric tons) of ice per year since 2004. With every successive year the loss has increased by 31 gigatons. About 60% of this melt is due to surface melting and the rest is caused by calving of glaciers into rivers and the sea.
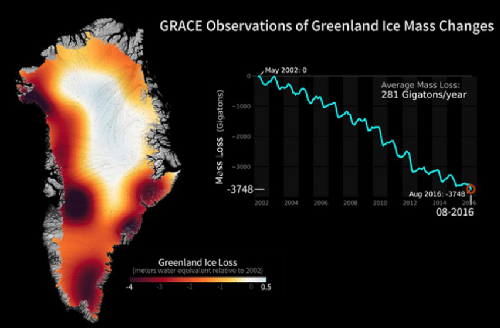
Figure 1: GRACE satellite observation of Greenland ice melt from
2002 to August 2016 (marked by a red dot).
The amount of Greenlands ice loss for August 2016, the last data available, is shown in Figure 1 on the colored map as meters water equivalent relative to 2002. The light grey color on the extreme right is 0.5 whereas the dark red on the extreme left is -4. The graph on the right is repeated below in Figure 2 with a red dot marking August 2016.
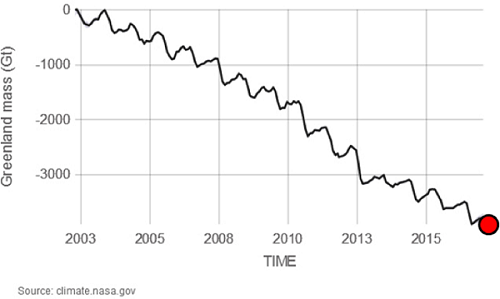
Figure 2: Overview of conditions from recent NASA GRACE satellite data on Greenland
ice melt.
Source: Climate Change: Vital Signs of the Planet: Land Ice
From the graph it is possible to deduce this table:
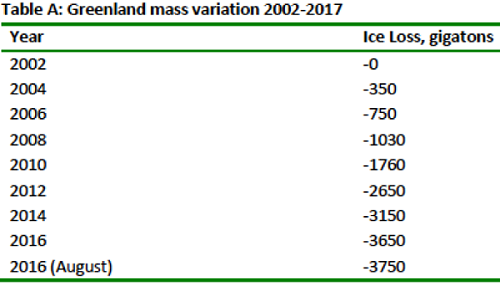
The rate of change is on average -286 gigatons/year with a margin of ±21. Although the last 5 years have shown a slower rate of loss.
Antarctic Ice Melt
The Antarctic ice sheet is the largest single mass of ice on earth. It contains 30 million cubic kilometers of ice, which is around 90% of the Earths ice mass. It covers an area of almost 14 million sq km which, if melted, would cause sea levels to rise by 58 meters. So far the temperature at Antarctic is rising more quickly than the global average, and it is losing about 118 gigatons of ice per year since 2002.
The latest news is that miles of ice is collapsing into the sea and that we have passed the point of no return.
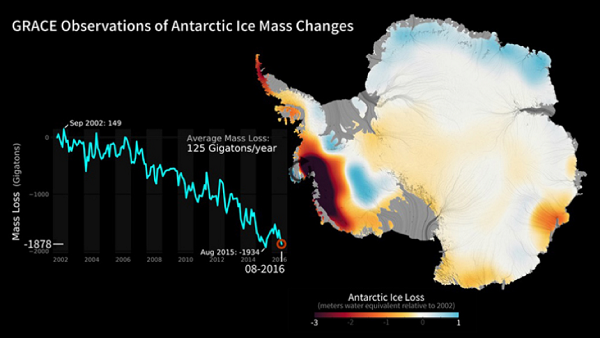
Figure 3: GRACE satellite observation of Antarctic ice melt from
2002 to August 2016 (marked by a red dot).
The amount of Antarticas ice loss in August 2016 is shown in Figure 3, again as a colored map representing meters water equivalent relative to 2002. The light grey color on the extreme right is 1 whereas the dark red on the extreme left is -3. Figure 4 repeats the graph that appears on the left.
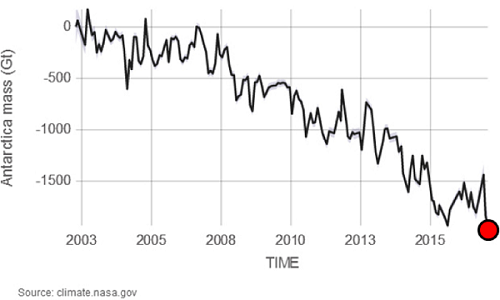
Figure 4: Overview of conditions from recent NASA GRACE satellite data on Antarctic
ice melt.
Source: Climate Change: Vital Signs of the Planet: Land Ice
From Figure 4 it is possible to deduce this table:
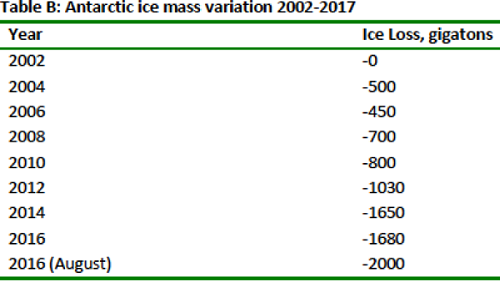
The rate of change is on average -127 gigatons/year with margin of ±30. Although the last 10 years have shown a faster rate of loss.
Sea Level Rise
Global mean sea level rise is caused by an increase in the volume of the ocean and this is a result of:
1) Warming of the ocean through thermal expansion.
2) Loss of ice by glaciers and ice sheets in Greenland and Antarctica.
3) Reduction of liquid water storage on land and the flowing of rivers.
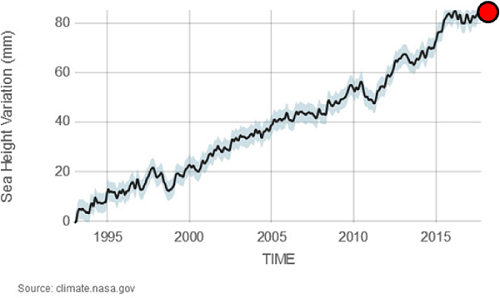
Figure 5: Variation in sea height over time from 1993 to November 2017.
Source: Climate Change: Vital Signs of the Planet: Sea Level
Very approximately, NASA satellite data give the following table:
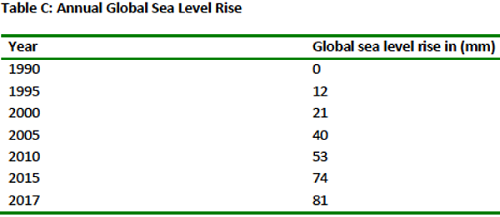
On average the rate of rise is 3.2 mm/year with margin ±0.4 mm. However, IPCC gives an average sea level rise between 1992-2011 to be about 0.74 mm/year. The IPCCs long range forecast, which depends on the assumed rate of sea level rise, ranges from a 45 mm to 75 mm rise in sea level by 2100. Many of the worlds largest cities, which are home to millions of people are threatened by this rise. In particular New York, London, parts of Florida and Shanghai where the Yangtze River delta is very broad and shallow.
Conclusion
The sad fact is if even if we follow through with the Paris Accord of 2015 to keep the rise in global temperature below 2 degrees C by 2100, the effects of sea level rise will still be with us. Scientist at Potsdam Institute have found by modeling that for every five years climate forcing emissions are not reduced as is happening at present between 2020 and 2035, we could experience an additional 20 centimeters of sea level rise. Projections for sea level rise vary, but the common threat remains.
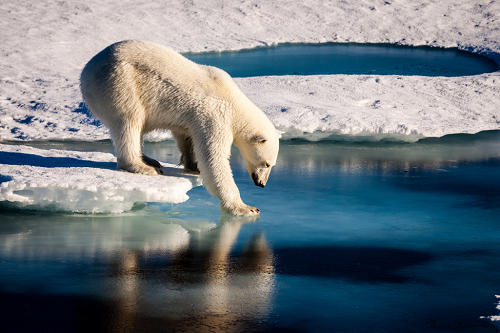
Figure 6: Polar bear faces shorter ice season in the Arctic.
Image by Mario Hoppman | Flickr | CC BY 2.0
This single picture sums all the proceeding words used to describe how humans are using up the worlds resources and causing distress to animals and plants on this planet at a staggeringly faster rate. At the same time, we are destroying our own civilization. In the end it all comes to the fact that we are overpopulated at 7.6 billion, which is projected to rise to 9.8 billion by 2050. What human society is doing at present is unsustainable and as a consequence we are mindlessly using up resources leaving little for our future generations. It is time we wake up and reverse our course.
|
ABOUT THE AUTHOR
Gioietta Kuo, MA at Cambridge, PhD in nuclear physics, Atlas Fellow at St Hildas College, Oxford and Princeton University plasma physics lab, is a research physicist. Over 70 professional articles and over 100 articles in environmental problems in World Future Society-wfs.org, amcips.org, MAHB and other worldwide think tanks. Also in Chinese in Peoples Daily and World Environment Magazine of the Chinese Ministry of Environmental Protection, and others in China. She can be reached at kuopet@comcast.net.
|


![[groups_small]](groups_small.gif)