The worlds largest oil companies are in serious trouble as their balance sheets deteriorate from higher costs, falling profits and skyrocketing debt. The glory days of the highly profitable global oil companies have come to an end. All that remains now is a mere shadow of the once mighty oil industry that will be forced to continue cannibalizing itself to produce the last bit of valuable oil.I realize my extremely unfavorable opinion of the worlds oil industry runs counter to many mainstream energy analysts, however, their belief that business, as usual, will continue for decades, is entirely unfounded. Why? Because, they do not understand the ramifications of the falling EROI Energy Return On Investment, and its impact on the global economy.
For example, Chevron was able to make considerable profits in 1997 when the oil price was $19 a barrel. However, the company suffered a loss in 2016 when the price was more than double at $44 last year. And, its even worse than that if we compare the companys profit to total revenues. Chevron enjoyed a $3.2 billion net income profit on revenues of $42 billion in 1997 versus a $497 million loss on total sales of $114 billion in 2016. Even though Chevrons revenues nearly tripled in twenty years, its profit was decimated by the falling EROI.
Unfortunately, energy analysts, who are clueless to the amount of destruction taking place in the U.S. and global oil industry by the falling EROI, continue to mislead a public that is totally unprepared for what is coming. To provide a more realistic view of the disintegrating energy industry, I will provide data from seven of the largest oil companies in the world.
The Worlds Major Oil Companies Debt Explode Since The 2008 Financial Crisis
To save the world from falling into total collapse during the 2008 financial crisis, the Fed and Central Banks embarked on the most massive money printing scheme in history. One side-effect of the massive money printing (and the purchasing of assets) by the central banks, was that it pushed the price of oil to a record $100+ a barrel for more than three years. While the large oil companies reported handsome profits due to the high oil price, many of them spent a great deal of capital to produce this oil.
For instance, the seven top global oil companies that I focused on made a combined $213 billion in cash from operations in 2013. However, they also forked out $230 billion in capital expenditures. Thus, the net free cash flow from these major oil companies was a negative $17 billion
and that doesnt include the $44 billion they paid in dividends to their shareholders in 2013. Even though the price of oil was $109 in 2013; these seven oil companies added $45 billion to their long-term debt:
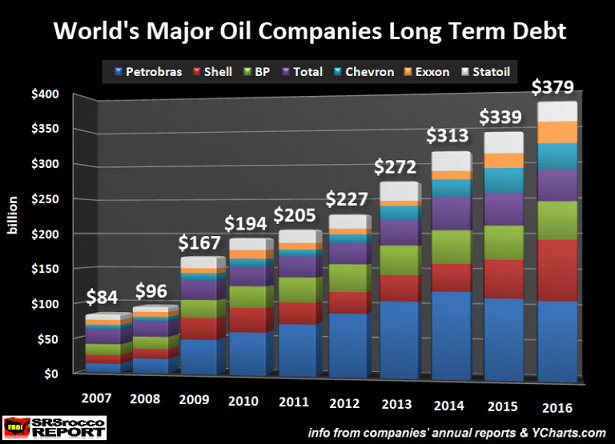
As we can see, the total amount of long-term debt in the group (Petrobras, Shell, BP, Total, Chevron, Exxon & Statoil) increased from $227 billion in 2012 to $272 billion in 2013. Isnt that ironic that the debt ($45 billion) rose nearly the same amount as the groups dividend payouts ($44 billion)? Of course, we cant forget about the negative $17 billion in free cash flow in 2013, but here we see evidence that the top seven global oil companies were borrowing money even in 2013, at $109 a barrel oil, to pay their dividends.
Since the 2008 global economic and financial crisis, the top seven oil companies have seen their total combined debt explode four times, from $96 billion to $379 billion currently. You would think with these energy companies enjoying a $100+ oil price for more than three years; they would be lowering their debt, not increasing it. Regrettably, the cost for companies to replace reserves, produce oil and share profits with shareholders was more than the $110 oil price.
There lies the rub
.
One of the disadvantages of skyrocketing debt is the rising amount of interest the company has to pay to service that debt. If we look at the chart above, Brazils Petrobras is the clear winner in the group by adding the most debt. Petrobrass debt surged from $21 billion in 2008 to $109 billion last year. As Petrobras added debt, it also had to pay out more to service that debt. In just eight years, the annual interest amount Petrobras paid to service its debt increased from $793 million in 2008 to $6 billion last year. Sadly, Petrobrass rising interest payment has caused another nasty side-effect which cut dividend payouts to its shareholders to ZERO for the past two years.
Petrobras Annual Dividend Payments:2008 = $4.7 billion
2009 = $7.7 billion
2010 = $5.4 billion
2011 = $6.4 billion
2012 = $3.3 billion
2013 = $2.6 billion
2014 = $3.9 billion
2015 = ZERO
2016 = ZERO
You see, this is a perfect example of how the falling EROI guts an oil company from the inside out. The sad irony of the situation at Petrobras is this:
If you are a shareholder, youre screwed, and if you invested funds (in company bonds, etc.) to receive a higher interest payment, youre also screwed because you will never get back your initial investment. So, investors are screwed either way. This is what happens during the final stage of collapsing oil industry.
Another negative consequence of the falling EROI on these major oil companies financial statements is the decline in profits as the cost to produce oil rises more than the economic price the market can afford.
Major Oil Companies Profits Vaporize
Even At Higher Oil Prices
To be able to understand just how bad the financial situation has become at the worlds largest oil companies, we need to go back in time and compare the industrys profitability versus the oil price. To find a year when the oil price was about the same as it was in 2016, we have to return to 2004, when the average oil price was $38.26 versus $43.67 last year. Yes, the oil price was lower in 2004 than in 2016, but I can assure you, these oil companies werent complaining.
In 2004, the combined net income of these seven oil companies was almost $100 billion
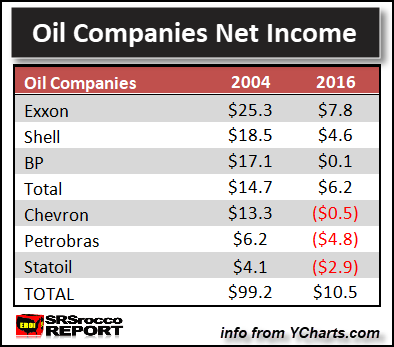
.. $99.2 billion to be exact. Every oil company in the group made a nice profit in 2004 on a $38 oil price. However, last year, the net profits in the group plunged to only $10.5 billion, even at a higher $43 oil price:
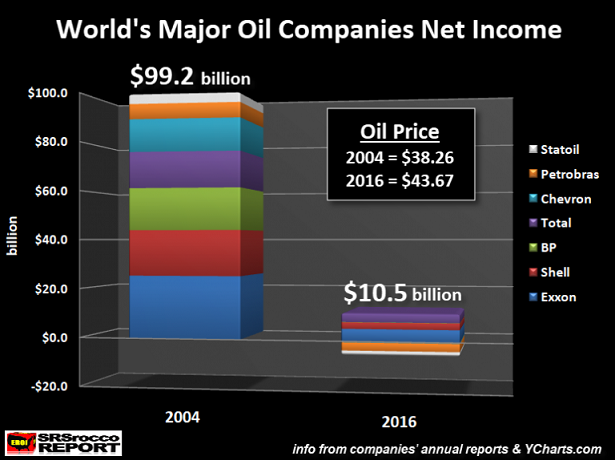
Even with a $5 increase in the price of oil last year compared to 2004, these oil companies combined net income profit fell nearly 90%. How about them apples. Of the seven companies listed in the chart above, only four made profits last year, while three lost money. Exxon and Total enjoyed the highest profits in the group, while Petrobras and Statoil suffered the largest losses:
Furthermore, the financial situation is in much worse shape because net income accounting does not factor in the companies capital expenditures or dividend payouts. Regardless, the worlds top oil companies profitability has vaporized even at a higher oil price.
Now, another metric that provides us with more disturbing evidence of the falling EROI in the oil industry is the collapse of the Return On Capital Employed. Basically, the Return On Capital Employed is just dividing the companys earnings (before taxes and interest) by its total assets minus current liabilities. In 2004, the seven companies listed above posted between 20-40% Return On Capital Employed. However, this fell precipitously over the next decade and are now registering in the low single digits:
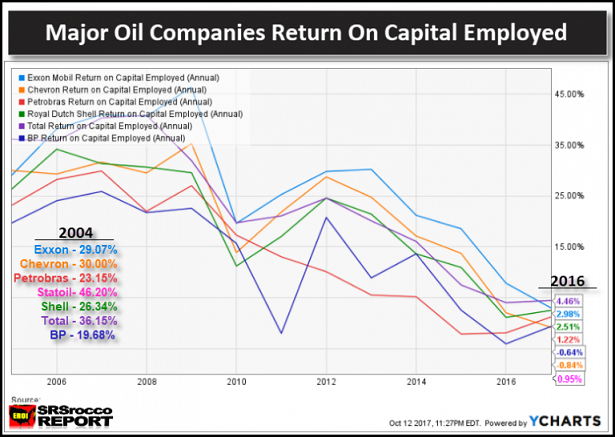
In 2004, we can see that BP had the lowest Return On Capital Employed of 19.68% in the group, while Statoil had the highest at 46.20%. If we throw out the highest and lowest figures, the average for the group was 29%. Now, compare that to the average of 2.4% for the group in 2016, and that does not including BP and Chevrons negative returns (shown in Dark Blue & Orange).
NOTE: I failed to include the Statoil graph line (Magenta) when I made the chart, but I added the figures afterward. For Statoil to experience a Return On Capital Employed decline from 46.2% in 2004 to less than 1% in 2016, suggests something is seriously wrong.
We must remember, the high Return On Capital Employed by the group in 2004, was based on a $38 price of oil, while the low single-digit returns by the oil companies in 2016 were derived from a higher price of $43. Unfortunately, the worlds largest oil companies are no longer able to enjoy high returns on a low oil price. This is bad news because the market cant afford a high oil price unless the Fed and Central Banks come back in with an even larger amount of QE (Quantitative Easing) money printing.
I have one more chart that shows just how bad the falling EROI is destroying the worlds top oil companies. In 2004, these seven oil companies enjoyed a combined net Free Cash Flow minus dividends of a positive $34 billion versus a negative $39.1 billion in 2016:
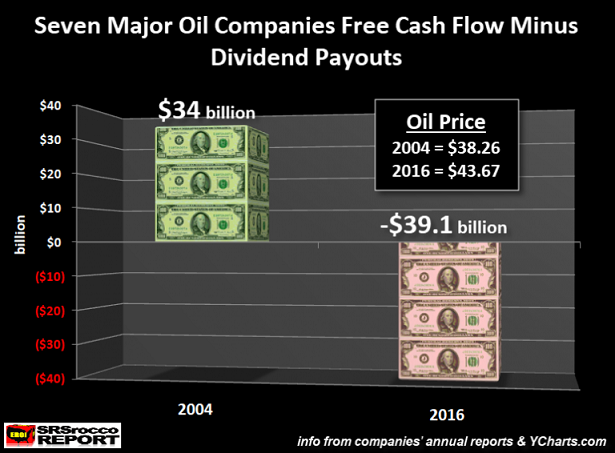
Let me explain these figures. After these oil companies paid their capital expenditures and dividends to shareholders in 2004, they had a net $34 billion left over. However, last year these companies were in the HOLE for $39.1 billion after paying capital expenditures and dividends. Thus, many of them had to borrow money just to pay dividends.
To understand how big of a change has taken place at the oil companies since 2004, here are the figures below:
Top 7 Major Oil Companies Free Cash Flow Figures
2004 Cash From Operations =
$139.6 billion
2004 Capital Expenditures =
..$67.7 billion
2004 Free Cash Flow =
$71.9 billion
2004 Shareholder Dividends =
..$37.9 billion
2004 Free Cash Flow Dividends = $34 billion
2016 Cash From Operations =
..$118.5 billion
2016 Capital Expenditures =
..$117.5 billion
2016 Free Cash Flow =
..$1.0 billion
2016 Shareholder Dividends =
.$40.1 billion
2016 Free Cash Flow Dividends = -$39.1 billion
Here we can see that the top seven global oil companies made more in cash from operations in 2004 ($139.6 billion) compared to 2016 ($118.5 billion). That extra $21 billion in operating cash in 2004 versus 2016 was realized even at a lower oil price. However, what has really hurt the groups Free Cash Flow, is the much higher capital expenditures of $117.5 billion in 2016 compared to the $67.7 billion in 2004. You will notice that the net combined dividends didnt increase that much in the two periods
only by $3 billion.
So, the lower cash from operations and the higher capital expenditures have taken a BIG HIT on the balance sheets of these oil companies. This is precisely why the long-term debt is skyrocketing, especially over the past three years as the oil price fell below $100 in 2014. To continue making their shareholders happy, many of these companies are borrowing money to pay dividends. Unfortunately, going further into debt to pay shareholders is not a prudent long-term business model.
The worlds major oil companies will continue to struggle with the oil price in the $50 range. While some analysts forecast that higher oil prices are on the horizon, I disagree. Yes, its true that oil prices may spike higher for a while, but the trend will be lower as the U.S. and global economies start to contract. As oil prices fall to $40 and below, oil companies will begin to cut capital expenditures even further. Thus, the cycle of lower prices and the continued gutting of the global oil industry will move into high gear.
There is one option that might provide these oil companies with a buffer
and that is a new even larger Fed and Central Bank money printing scheme which would result in severe inflation and possibly hyperinflation. But, that wont be a long-term solution, instead just another lousy band-aid in a series of band-aids that have only postponed the inevitable.
The coming bankruptcy of the once mighty global oil industry will be the death-knell of the world economy. Without oil, the global economy grinds to a halt. Of course, this will not occur overnight. It will take time. However, the evidence shows that a considerable wound has already taken place in an industry that has provided the world with much-needed oil for more than a century.
Lastly, without trying to be a broken record, the peak and decline of global oil production will destroy the value of most STOCKS, BONDS and REAL ESTATE. If you have placed most of your bets in one of these assets, you have my sympathies.
|
ABOUT THE AUTHOR
Independent researcher Steve St. Angelo (SRSrocco) started to invest in precious metals in 2002. Later on in 2008, he began researching areas of the gold and silver market that, curiously, the majority of the precious metal analyst community have left unexplored. These areas include how energy and the falling EROI Energy Return On Investement stand to impact the mining industry, precious metals, paper assets, and the overall economy.
Steve considers studying the impacts of EROI one of the most important aspects of his energy research. For the past several years, he has written scholarly articles in some of the top precious metals and financial websites.
You can find many of Steves articles on noteworthy sites, such as GoldSeek-SilverSeek, Market Oracle, Financial Sense, GoldSilver.com, SilverDoctors, TFMetals Report, Outsiderclub, SGTreport, BrotherJohnF, Hartgeld, Der-klare-blick, PeakProsperity, SilverStrategies, DollarCollapse, FurtureMoneyTrends, Sharpspixley, FinancialSurvivalNetwork, Pmbull, Deviantinvestor, PmBug, Wealthwire, and ZeroHedge.
|


![[groups_small]](groups_small.gif)