Simulation Scenarios of the Transition to Sustainability
The key working hypothesis is that the transition from consumerism to sustainability will revolve around the transition from fossil fuels to clean energy, and this transition will come to pass whether we like it or not. However, the amount of human suffering during this process will depend on human adaptability and social cohesion. The simulations are not meant to be predictive but to show a range of plausible scenarios.
Solidarity reinforces Sustainability and vice versa
The horizontal and vertical scales are not shown in order to avoid giving the impression that this is a prediction. This is a simulated scenario, not a prediction. It portrays dynamic modes of system behavior that can be expected during the transition from consumerism to sustainability, as follows:
~ Population, production, and consumption peak, stagnate and/or oscillate with downward trend, and eventually decrease to long-term sustainable levels.
~ The peak in energy availability is followed by a long decline until it settles to the steady-state flow that is allowed by solar (and perhaps other cosmic) sources of energy.
~ The solidarity index is an indicator of social cohesion, which is tightly coupled with the sustainability of resource usage.
This is not intended to be an "alarmist" scenario. However, it would be wise to take the Precautionary Principle into account when formulation sustainable development policies as we enter the Anthropocene Age. Widespread violence is bound to emerge if demographic and consumption adjustments are to be made involuntarily. Is this "the future we want" for the entire community of nations? NB: The current SDSIM 2.0 is a demo, not a capability.
Integral Human Development is an expression based upon the truth that human development cannot be reduced or divorced into constituent parts. True progress does not and cannot happen, if only one aspect of the human person is being addressed to this end.
Maslow's Hierarchy of Human Needs
Adapted from Wikipedia
As a matter of principle, any strategy for the transition to clean energy must recognize integral human development as the most fundamental requirement to guide both public and private initiatives. Integral human development builds on respect for human rights and diligence on human duties, both individually and institutionally. A fundamental document is The Universal Declaration of Human Rights, approved by the United Nations General Assembly on 10 December 1948.
Hierarchy of Human Needs
Abraham Maslow (USA, 1908-1970) created the "hierarchy of human needs" in the 1940s. Maslow's model explicitly takes into account the physiological, safety, emotional, love/belonging, esteem/self-esteem, and self-actualization stages of integral human development. The hierarchy of human needs is usually represented as a pyramid, with the most basic needs at the bottom and the socialization needs at the top. There are many variations of the pyramid: one is shown to the right and others can be easily found. Going upward, the progression for each human being is to satisfy (1) the basic physical and physiological needs, (2) the need for safety and security, (3) the need psychological well-being, (4) the need for self-actualization (self-esteem, social responsibility), and (5) self-giving to others, or at least the desire to seek the common good in conjunction with legitimate self-interest. For further discussion of Maslow's "levels of human development" - and other models of human development - the reader is referred to the May 2010 issue of Mother Pelican. Attaining a culture of solidarity and sustainability is practically impossible under level 3, and generally requires level 4. This means that enabling people "to live to their full potential" requires, beyond meeting basic physical needs, access to educational and job opportunities as well as freedom for each person follow their "vocation" in life under conditions of human solidarity, social justice, and ecological sustainability. It is becoming increasingly difficult to provide such opportunities in the context of current population growth trends.
"The current world population of 7.3 billion is expected to reach 8.5 billion by 2030, 9.7 billion by 2050, and 11.2 billion in 2100, according to a United Nations report released today. The revised U.N. estimates counter previous projections, which had said that global population would peak at roughly 9 billion by 2050, then gradually decline. Most growth will occur in developing regions, the new report says, especially Africa, which is expected to account for more than half of the worlds population growth between 2015 and 2050. India is expected to become the most populous country, surpassing China around 2022. Nigeria could surpass the United States by 2050, which would make it the third-largest country in the world, the U.N. projects. The concentration of population growth in the poorest countries presents its own set of challenges, making it more difficult to eradicate poverty and inequality, said John Wilmoth, a director in the U.N.s Department of Economic and Social Affairs." Source: Environment 360, Yale University, 29 July 2015
Climate change has the potential to cause significant harm to people and the planet (Stern, 2007; Weitzman, 2007; Tol, 2011). Thus, a great deal of attention has been devoted to devising mitigation policies, such as carbon taxes, cap-and-trade schemes, and energy efficiency mandates. These policies have economic costs and environmental benefits. As a result, when economists try to calculate optimal climate change mitigation policy, they must weigh these costs and benefits (Nordhaus, 2013; Golosov et al., 2014). But what if there are policies for which there is no trade-off between economic and environmental priorities? Such policies could alleviate poverty and improve living standards while still providing much needed environmental protection.
We recently published a paper in Environmental Research Letters, Is faster economic growth compatible with reductions in carbon emissions? The role of diminished population growth, that demonstrates the potential for slower population growth to simultaneously increase income per capita and lower carbon emissions (Casey and Galor, 2017). Population growth is a major driver of carbon emissions, both historically and in projections of future emissions (Raupach et al., 2007). Yet, relatively little attention has been devoted to investigating the potential for population policies to influence global climate change (ONeill et al., 2012). By population policies, we refer to policies that affect population growth via voluntary decisions made by individuals. Indeed, the entire reason to prefer policies that achieve both economic and environmental priorities is to improve the lives of individuals as they value them.
Our Findings
Decreases in population also decrease overall economic activity, leading to less carbon emissions. At the same time, there are many mechanisms through which decreases in population growth especially when driven by fertility increase output per person. Thus, decreases in population growth have two offsetting effects on carbon emissions: the direct decrease in economic activity and the increase in economic activity per person.
Our paper measures the overall effect of decreases in population growth on carbon emissions in a two-step process. First, we use cross-country data to estimate the elasticity of carbon emissions with respect to population and income per capita. Consistent with existing literature, we find that the elasticity with respect to population is nearly seven times larger. Thus, decreases in population growth could decrease overall emissions while still substantially increasing income per capita. The remaining step is to estimate the impact of lower population growth on income per capita. To do so, we focus on the example of Nigeria and use a recently constructed economic-demographic model to estimate the effect of lower fertility on economic outcomes (Ashraf et al., 2013). We find that reductions in fertility can simultaneously lead to a 15% increase in income per capita and a 35% decrease in carbon emissions by 2100 C.E.
Thus, our analysis demonstrates the potential for decreases in population growth via decreases in fertility to simultaneously achieve economic and environmental policy priorities, circumventing a trade-off central to most climate change mitigation policies. Our analysis demonstrates the potential for these outcomes, without providing estimates of effects on a global scale or in response to specific policies. We hope that future work will extend our analysis in these directions.
Policy Implications
Our results have important implications for climate change policy. There are two reasons why population-based approaches may garner more political support than more conventional policy options. First, the principle of differentiated responsibility is widely accepted in the international community, and population policies have the potential to let high-fertility, low-income countries decrease emissions without imposing an undue burden on poverty alleviation and economic prosperity (Brunee and Strick, 2013). Moreover, by eliminating the trade-off between environmental and economic outcomes, population-based policies may be able to overcome free-rider effects that hamper efforts to address problems that are global or international in nature (Stavins, 2011).
Our research abstracts from the specifics of population-based policies and focuses instead on an exogenous reduction in fertility, but considering specific policies is obviously an important component to future work. There are several policies that may lead to lower fertility, the most obvious of which is the provision of contraceptives. Evidence suggests that there is a significant unmet demand for contraceptives in developing countries (Gillepsie et al., 2013). Moreover, a recent study for the Copenhagen Consensus Project suggests that policies targeting fertility via contraception have high returns (Kohler and Berman, 2014). Our earlier paper on the subject provides a broader discussion of the types of policies that could affect fertility in both developing and developed countries, focusing on the economic factors that alter individuals incentives (Galor and Casey, 2014). As with all decisions, parents have limited resources to allocate to raising children, and as a result, many economic policies will influence fertility rates. In particular, parents must decide how to allocate resources between having more children and investing in the future of each child. There is considerable evidence for this `quantity-quality trade-off in the economics literature (Guinnane, 2011; Galor, 2012). Thus, policies that increase incentives for investment in education, for example, can also lead to lower fertility levels. Such policies could include targeted interventions, such as subsidies for education, or broader macroeconomic interventions, such as increases in the potential for high-skill migration or subsidizing industries that demand skills from local workers (Galor and Mountford, 2008; Wheeler and Hammer, 2010; Docquier and Rapoport, 2012).
Conclusion
Most policies aimed at mitigating global climate change face a trade-off between economic and environmental outcomes. By contrast, our recent paper provides evidence that population-based policies may have the ability to simultaneously increase income per capita and lower carbon emissions. This suggests that these policies could play an important role in the global response to climate change. They may also receive increased political support by lessening challenges of international burden sharing and free-rider concerns.
References
Ashraf, Quamrul H., David N. Weil, and Joshua Wilde. The effect of fertility reduction on economic growth. Population and Development Review 39, no. 1 (2013): 97-130.
Brunnée, Jutta, and Charlotte Streck. The UNFCCC as a negotiation forum: towards common but more differentiated responsibilities. Climate Policy 13, no. 5 (2013): 589-607.
Casey, Gregory, and Oded Galor. Is faster economic growth compatible with reductions in carbon emissions? The role of diminished population growth. Environmental Research Letters 12, no. 1 (2017): 014003.
Docquier, Frédéric, and Hillel Rapoport. Globalization, brain drain, and development. Journal of Economic Literature 50, no. 3 (2012): 681-730.
Galor, Oded, and Andrew Mountford. Trading population for productivity: theory and evidence. Review of Economic Studies 75, no. 4 (2008): 1143-1179.
Galor, Oded, and Gregory Casey. Benefits and Costs of the Population and Demography Targets for the Post-2015 Development Agenda (2014).
Gillespie, Duff, Saifuddin Ahmed, Amy Tsui, and Scott Radloff. Unwanted fertility among the poor: an inequity? Bulletin of the World Health Organization 85, no. 2 (2007): 100-107.
Golosov, Mikhail, John Hassler, Per Krusell, and Aleh Tsyvinski. Optimal taxes on fossil fuel in general equilibrium. Econometrica 82, no. 1 (2014): 41-88.
Guinnane, Timothy W. The historical fertility transition: a guide for economists. Journal of Economic Literature 49, no. 3 (2011): 589-614.
Kohler, Hans-Peter, and Jere R. Behrman. Benefits and Costs of the Population and Demography Targets for the Post-2015 Development Agenda. Copenhagen Consensus Center Population and Demography Assessment Paper (as of 3 October) (2014).
Nordhaus, William D. The climate casino: risk, uncertainty, and economics for a warming world. Yale University Press, 2013.
ONeill, Brian C., Brant Liddle, Leiwen Jiang, Kirk R. Smith, Shonali Pachauri, Michael Dalton, and Regina Fuchs. Demographic change and carbon dioxide emissions. Lancet 380, no. 9837 (2012): 157-164.
Raupach, Michael R., Gregg Marland, Philippe Ciais, Corinne Le Quéré, Josep G. Canadell, Gernot Klepper, and Christopher B. Field. Global and regional drivers of accelerating CO2 emissions. Proceedings of the National Academy of Sciences 104, no. 24 (2007): 10288-10293.
Stavins, Robert N. The problem of the commons: still unsettled after 100 years. American Economic Review 101, no. 1 (2011): 81-108.
Stern, N.H., 2007. The economics of climate change: the Stern review. Cambridge University press.
Tol, Richard SJ. The economic effects of climate change. Journal of Economic Perspectives 23, no. 2 (2009): 29-51.
Weitzman, Martin L. A review of the Stern Review on the economics of climate change. Journal of Economic Literature 45, no. 3 (2007): 703-724.
Wheeler, David, and Dan Hammer. The economics of population policy for carbon emissions reduction in developing countries. Center for Global Development Working Paper 229 (2010).
Human development cannot happen in a vacuum. Therefore, maintaining the integrity of the human habitat is essential for sustainable human development. One fundamental document is The Earth Charter, approved by the Earth Charter Commission 29 June 2000 after 5 years of preparation and worldwide consultation. Another fundamental document is the annual Human Development Report of the United Nations, in which the Human Development Index (HDI) is correlated with Ecological Footprint data on a country by country basis, showing that "only a few countries come close to creating such a globally reproducible high level of human development without exerting unsustainable pressure on the planets ecological resources."
There is an emerging consensus that climate change has become the central issue of human habitat desintegration.
HUMANITY AND THE HUMAN HABITAT
HOW MANY PEOPLE CAN THE PLANET SUPPORT? CONSUMING HOW MUCH?
Making sense of the early 2000s warming slowdown, John C. Fyfe, Gerald A. Meehl, Matthew H. England, Michael E. Mann, Benjamin D. Santer, Gregory M. Flato, Ed Hawkins, Nathan P. Gillett, Shang-Ping Xie, Yu Kosaka and Neil C. Swart, Nature, 1 February 2016
UNITED NATIONS Intergovernmental Panel on Climate Change (IPCC), Fifth Assessment Report (AR5),
Summary for Policymakers (Final), 3 June 2014
"Illustration of the core concepts of the WG2 AR5. Risks of climate-related impacts results from the interaction of climate-related hazards (including hazardous events and trends) with the vulnerability and exposure of human and natural systems. Changes in both the climate system (left) and socioeconomic processes including adaptation and mitigation (right) are drivers of hazards, exposure, and vulnerability."
This essay is organized around the following themes: The Modern Democratic Concept of Equality; Economic Inequality; The Earth Charter and the Principle of Equality; The Earth Charter and Economic Inequality; A World Founded on Visions of Equality and Sustainability.
3. Mitigation of Habitat Degradation & Climate Change
Could Rising Seas Yield Common Ground?
Exploring Opportunities for Climate Collaboration
with the Trump Administration
Philip Killeen
Originally published by
Worldwatch Institute, 14 February 2017 REPRINTED WITH PERMISSION
Try it yourself. A quick Twitter search demonstrates the depth of U.S. President Donald Trumps skepticism of the science behind human-induced climate change. Unsurprisingly, this belief formed the foundation for much of Trumps campaign platform for energy policy. Combined with the prospect of full Republican control in Congress for at least the next two years, it is likely that the Trump administration will diminish President Obamas legacy for climate action, which is supported strongly by a majority of Americans. However, silver linings for a sustainable U.S. energy future may yet be visible in the populist agenda adopted by the incoming administration. Could Trump have a positive, albeit unintentional, climate legacy?
Trumps Climate Agenda
In May 2016, then-candidate Donald Trump released his America First Energy Plan, including a number of measures to be taken within the first 100 days of his presidency. Broadly speaking, these commitments reflect the intent of the Trump administration to deregulate domestic U.S. energy production to drive private sector growth for coal, oil, and natural gas. So far, the President seems to be fulfilling this promise. By greenlighting the Keystone XL and Dakota Access pipeline projects, nominating climate skeptic Scott Pruitt to lead a silenced Environmental Protection Agency (EPA), and ordering a review of the Paris Climate Agreement, Trump has sent an unmistakable signal.
It is worth noting, however, that this platform is surprisingly muted toward domestic renewable energy itselfseen by most as a core pillar to meeting U.S. climate goals set at the December 2015 climate talks in Paris. Instead, Trumps Energy Plan seems to echo growing public sentiment about perceived federal regulatory overreach over fossil fuels and its impact on economic growth and, most importantly, job creation. The implication here is that federal regulations, rather than fundamental economics, are driving the declines in domestic fossil fuel industries such as coal and oil.
Energy Regulations: A Red Herring?
The unfortunate reality for Trump voters inspired by this message is that Americas declining fossil fuel industries have little to do with federal regulation. Rather, new research is making clear that cheap and domestically sourced natural gas and renewable energy are outcompeting coal for electricity generation. Driven primarily by the advent of hydraulic fracturing or fracking technologies, domestic consumption of natural gas for electricity rose to a record high in 2015.
Similarly, 2015 easily broke records for U.S. renewable energy, adding over 10,000 megawatts (MW) in new capacity3,500 times more than the 3 MW added from coal. Even for regions of the country with the cheapest coal resources, such as Wyomings Powder River Basin, coal now competes poorly with both natural gas and renewable alternatives. Unsurprisingly, U.S. electricity consumption from coal in 2015 fell to one third of peak levels in 2007.
The strong performance of renewable energy technologies in the United States has come despite disproportionately high federal support for fossil fuels. An estimated $150 billion was spent through federal stimulus programs and subsidies for renewable energy during the Obama administration. By comparison, fossil fuel subsidies in the United States exceed $37.5 billion annually, and totaled a whopping $300 billion over the course of Obamas presidency.
Skeptics of this comparison correctly point out that fossil fuels account for more of the U.S. primary energy mix than renewables and therefore have higher generation productivity per unit of federal monetary support. What this perspective ignores, however, is the tremendous historic skew in federal support for fossil fuels over renewables. Existing estimates of federal support for fossil fuels also do not incorporate the tremendous costs borne by U.S. taxpayers related to the military, climate, local environmental, and health impacts of the fossil fuel industry, estimated to be nearly $700 billion annually or 3.8 percent of gross domestic product.
The marked decline in coal jobs in the United States is closely associated with increased automation in the industry as well. Although new positions in the coal industry are being created in the development, observation, servicing and maintenance of these machines, automation is expected to dramatically reduce operational jobs in drilling, blasting, and transport, which constitute roughly 70 percent of coal mine employment. Overall, it is estimated that automation is likely to replace 40 80 percent of workers in coal mines, with newer mines and those with substantial remaining reserves being the most targeted for automation.
Scraping the Bottom of the Barrel
Putting aside the emergence of cheap American energy alternatives and accelerating industry automation, domestic oil and coal companies are simply running out of affordable options to maintain historic output levels. Gone is the age of surface-mined high-quality coal reserves and bursting shallow oil rigs. Having already exploited this low-hanging fruit, modern fossil fuel companies are facing the unenviable choice between increasingly capital-intensive extraction processes and lower quality-fuel resources. In both cases, companies are struggling to match historic profit-margins due to the energy needed to extract or upgrade modern coal and oil resources.
For oil companies, this choice is often among expensive and environmentally destructive extraction practices such as tight shale oil fracking, deepwater oil extraction, and low-quality oil tar sands resources. Meanwhile, coal companies are deploying expensive mountaintop removal and deep underground mining techniques to extract increasingly low-energy-content lignite coal. These factors are reflected in the U.S. Energy Information Administrations 2017 Annual Energy Outlook, which projects that coal and crude oil prices will generally increase through the year 2040. These fundamentals are not, however, restricted to coal and oil. Already, market analysts are speculating when, not if, the natural gas industry will face similar constraints.
Trumps Growth Dilemma
If President Trumps campaign promise of sustained jobs growth is not forthcoming from Americas fossil fuel industries, where then can he turn? Clean energy technologies and associated infrastructure present a massive, and so-far underutilized, opportunity for meaningful collaboration on climate change with the Trump administration. Indeed, Trumps campaign platforms for infrastructure investment in a modern and reliable electricity grid and creating 25 million new jobs in the next decade dovetail with the continued strong performance of renewable energy in the United States.
Wind plant manufacturing is currently the fastest growing job sector in the U.S. economyand this employment has been concentrated in the Rust-Belt states, which were pivotal in swinging the presidential election toward Trump. Similarly, domestic solar companies are growing 12 times faster than the overall job creation rate in the U.S. economy. In total, renewable energy sector employment in the United States grew 6 percent in 2016 to 769,000 jobs, while employment in gas, coal, and oil exploration and extraction combined fell 18 percent, to 375,000 jobs.
Time for an Infrastructure New Deal?
Aside from the growing economic contribution of renewable generation technologies themselves, modernization of U.S. electrical grid infrastructure is perhaps the best opportunity for meaningful climate action during the Trump administration. Currently, electricity in the United States is transmitted and consumed within three geographically distinct grid systems, centered on the Eastern and Western seaboards and in Texas. Because these systems rely on inefficient and aging alternating current transmission cables, electricity cannot be economically transmitted between these grids, regardless of its generation source. As a result, electricity generated from renewables is periodically unable to be linked to sufficiently large demand markets, resulting in wasted generation potential.
Examples of this issue, known as curtailment, include Texan utility companies paying wind farms to shut down their turbines on windy days, and solar panels outside Tucson, Arizona, being left inert on sunny days. Coupled with the fluctuation or intermittency of energy supply from individual solar and wind generation facilities, curtailment presents a significant roadblock hindering private sector uptake of renewable energy investment opportunities. The fact that renewables are consistently breaking global records under these constraints suggests that we are only beginning to capture their true potential.
Proposals for grid modernization, such as the Clean and Secure Grid Initiative, have suggested a realistic pathway through which these challenges can be addressed while providing a level playing field for all energy technologies to compete, creating thousands of jobs, and meeting emerging security threats that are aligned with the Republican agenda. The initiative proposes establishing a tax credit for private sector investment in an underground high-voltage direct current (HVDC) transmission system to connect the three isolated U.S. electrical grids. This system would enable the efficient transmission of energy across long distances, allowing energy technologies to compete on an even footing. Aside from its associated short- and long-term job creation benefits, a national grid would provide significant grid-security benefits, including protection from environmental disasters and terrorist threats.
A groundbreaking study underlying this initiative indicates that, with a national grid, the United States has sufficient geographic and meteorological diversity to supply much of moment-to-moment electricity demand from renewable sources without the need for battery storage and with the technical possibility of up to an 80 percent reduction in power sector carbon emissions. Importantly, this emissions reduction potential does not come at the cost of arbitrarily selecting energy industry winners and losers or increasing electricity costs for consumers. A Priority List of emergency and national security infrastructure projects prepared for the Trump administration suggests that there is significant mutual interest in this opportunity.
Looking Beyond Trumps Symbolic Gestures
While early signs have been troubling, climate activists should not give up on the prospect of collaboration with more conservative-leaning players. Most of Trumps early environmental executive actions should be understood for what they are: symbols rather than substance. A State Department assessment of the Keystone XL pipeline suggests that fossil fuel companies will find alternative pathways to sell their oil regardless of whether the pipeline is installed or not. Federal greenlighting of these projects will not exempt them from state-level regulatory scrutiny nor will it reverse increasingly grim global oil market conditions.
The significance of Trumps campaign promise to cancel the Paris Climate Agreement is more difficult to quantify. On one hand, it demonstrates the Presidents misunderstanding of what the Agreement actually isan international accord comprising individual country-level climate mitigation and adaptation commitments known as Nationally Determined Contributions (NDCs). On the other hand, Trump could issue an executive order withdrawing U.S. participation from the Paris Agreement, even though the United States would remain legally bound to its procedural commitments for up to four years.
While they would be hotly contested, there are various avenues through which the United States could fail to achieve its NDC, including by not implementing the Clean Power Plan and by reneging on its $3 billion pledge to support developing countries in implementing their NDCs. The geopolitical implications of stepping down from this leadership role, however, should not be lost on Trumps more strategic-thinking cabinet members. Already, China is positioning itself to capitalize on international goodwill from this potential void in climate leadership.
Make Conservatives Conserve Again
Supporting Americas booming clean energy sector through infrastructure investment offers perhaps the fastest avenue through which the Trump administration and its allies on Capitol Hill can fulfill campaign promises for domestic economic rejuvenation. Rejecting this olive branch would be a dangerous move for Trump, especially given that a healthy majority of Americans acknowledges the causality and severity of climate change and support taking robust action against it. Already, many right-of-center political groups are beginning to realign themselves according to this growing consensus. Some have even begun to explore more radical opportunities for free-enterprise-oriented climate legislation such as a revenue-neutral and border-adjusted carbon tax.
Rather than a challenge, the Trump administration should see this enthusiasm as an opportunity to revive the tradition of Republican environmental stewardship. From the creation of our first national parks under Teddy Roosevelt to the establishment of the EPA under Richard Nixon and the Clean Air Act under George H.W. Bush, conservatives historically have found pragmatic and market-compatible solutions to some of our greatest environmental challenges. Time to act on climate change is of the essence as 2016 broke global heat records for the third year in a row.
ABOUT THE AUTHOR
Philip Killeen is a research associate in the Worldwatch Institutes Climate and Energy Program.
4. Adaptation to Habitat Degradation & Climate Change
PER CAPITA OIL
The key to understanding the end of the Industrial Age
John G. Howe
Originally published in the author's website PER CAPITA OIL, February 2017
Please read and personally forward through your contacts on cyberspace and social media the following facts, numbers, and science. This is the untold, non-political context for most of the world's growing ills and chaos. Your added personal energy is critical.
See linked Appendix A, and Book Power Point Summary Figures 2, 4, 10: oil is a finite resource. The world has already used 1.2 trillion barrels from an estimated ultimate recoverable resource (URR) of 2.4 trillion barrels, with half of that in the last 25 years at the rate of one billion barrels every eleven days. We are at, or near the midpoint of the two-lifetime, oil-fueled Industrial Age.
AMERICANS ARE THE NUMBER ONE OIL CONSUMERS
The U.S. with 1/25 of the world population uses 1/4 of world's oil.
World total oil use: 32 billion barrels per year
U.S. total oil use: 7 billion barrels per year
Of that 7 billion barrels, almost one half (3.2 billion barrels), is consumed just as gasoline to drive over three trillion miles per year. Most of the other half is for diesel fuel, jet fuel and heating oil as the basis for support of the energy-intensive, ubiquitous, mobile, American lifestyle. Americans use as much oil just for gasoline as China's or Western Europe's total oil consumption.
HOW MUCH TIME DO WE HAVE LEFT
See Power Point Summary Figure 9: at the present rate, and assuming world-wide consumers can afford higher-priced remaining oil, there are less than 40 years left in the world oil-age at the annual rate of 32 billion barrels (1.2 trillion barrels divided by 32 equals 37.5 years).
Based on the very optimistic assumption of 50 billion barrels left in the U.S. at an acceptable price, there are 7 years left of business as usual if only U.S. oil is used (50 billion barrels divided by 7 equals 7.1 years). If one half of U.S. oil is imported as is presently the case, there are 15 years left (50 billion barrels divided by 3.5 equals 14.3 years). To extend the U.S. oil age would require a higher percentage of imported oil. Note: In January 2017, the American Petroleum Institute would like us to believe we have so much U.S. oil we can "become an exporter of crude oil" (USA Today, January 13, 2017).
USING "PER CAPITA OIL" TO HELP US UNDERSTAND
Power Point Summary Figure 3 is another way of understanding the numbers as per-person consumption (per capita). Americans are burning oil at a per capita rate of 22 barrels per person per year (b/p/y). In sharp contrast, the average world per capita oil consumption (not including U.S.) is 3 b/p/y. A staggering half of the U.S. 22 b/p/y is just for gasoline (11 b/p/y). This is the same per capita rate as in industrialized Western Europe for all of their oil consumption which has been kept in check for years by very high gasoline taxes and small fuel-efficient cars.
LOWER PRICES AND GROWING U.S. DEBT EQUALS LESS DEMAND
How can this be? For years, conventional wisdom taught us that the decline of the oil age would be signaled by higher oil cost. Further thought argues against this theory. In the past, as long as there was enough wealth and purchasing power in the U.S. economy to support ever-more expensive extraction technology (horizontal fracking, tar sands, deep off-shore, polar, etc.), the rate of increased production was supported by a steady price increase.
Then, in the next ten years following 2005, when oil approached $100 per barrel and gasoline reached $4 per gallon, the average family of four spent $8,800 (22 b/p/y times $100) annually to fuel their petroleum-based lifestyle. A low income family trying to survive on minimum wage or social security could not afford the $8800 cost so gasoline demand, by a growing pool of poorer, increasingly indebted Americans, decreased (called demand destruction). This contributed to growing wealth disparity as wealthier Americans continued to consume more of everything.
In the same time period, Chinese imports continued to increase thus contributing to their economic growth but made by cheap labor living on a per capita oil consumption of 2 b/p/y.
This precarious world-balance between oil supply and demand continued until 2014 when the Saudi government tired of losing market share to the new, increasingly expensive, non-conventional sources. This, combined with growing economic woes from other world oil suppliers like Russia, triggered a reduction in world production. Marginal, non-conventional U.S. suppliers, along with oil-field service companies, were highly leveraged. Many ceased production and/or went bankrupt while waiting for a quick price recovery. The result was a sharp decline in extraction and a drop in price to the $40 per barrel range.
Classical economics would predict a concurrent rebound in demand, but the largest world oil-consumer bloc, the indebted American motorist, did not quickly respond thus keeping price and production at low level. Now, as we move into 2017, oil is moving back toward the $60 range. Unfortunately, this is a double-edged sword because the price of gasoline will climb back above to $3 per gallon thus forcing highly-indebted American motorists to end a temporary resurgence of prosperity in order to redirect their meager income back to gasoline and away from other discretionary sectors of the economy (see Figure 12 in the Power Point Summary).
In the spring of 2017, when Americans hit the road again, the new administration will be faced with the irreconcilable tension between the higher cost from a reinvigorated oil industry and the public's growing inability to afford gasoline. The economy will take a new hit as the cost of 400 million gallons per day at $3 per gallon (1.2 billion dollars) takes priority in spending habits.
U.S. GASOLINE RATIONING, SO ALL AMERICANS WILL EQUITABLY SHARE MITIGATION OF THE END OF THE OIL
Figure 14 in the Power Point Summary outlines a plan and lists the positives for a controlled, nation-wide reduction in gasoline demand by the number 1 consumer bloc in the world. Americans will eventually be forced by waning supply to reduce oil consumption to the world average of 3 b/p/y whether they like it or not. Rationing would anticipate this inevitability and help smooth the transition. Figures 13, 14, and 15 show the details along with the reduction in CO2 emissions to be expected from fifty-percent gasoline rationing.
POPULATION GROWTH, THE DENOMINATOR IN PER CAPITA OIL
Meanwhile, world (including U.S.) population increases inexorably as shown in Figure 7 of the Power Point. This is a looming tragedy of historically unprecedented magnitude. Nowhere-near adequate food will be possible without the inexpensive oil which made it possible for one individual farmer to grow and ship food thousands of miles to an average of three hundred consumers. Chapter 6 in the linked book, The End of Fossil Energy defines the math of "population momentum", and why a fertility rate of zero children per female would be necessary for population to decline in synch with declining oil.
OTHER SUBJECTS DIRECTLY RELATED TO OIL
Climate Change is a very real but much longer-range concern. Without cheap oil there will be a decline of all fossil fuels including coal, and therefore less green-house gas emissions. Many parts of the world will have an altered, but not life-threatening, climate. Figure 15 in the Power Point shows sources of the present world CO2 emissions, most of which are from burning eight billion tons of coal globally, with one-half of that in smoggy China.
Renewable Energy cannot possibly replace the concentrated energy of fossil fuels which took millions of years to accumulate. Figure 10 in the Power Point Summary shows dilute incoming solar energy as only one-percent of total present consumption. Any increase in solar energy, including wind, would require massive oil support and financial investment plus time, much longer than remains in the oil age. All solar energy is weak and sporadic thus requiring substantial storage, the "Achille's Heel" of all energy sources. Hydro is maxed-out because of required land mass and topography. Nuclear is limited by safety, fuel supply, and long-term expensive investment. In addition, renewables provide only electricity which will not fuel our transportation needs without massive investments of capital, finite fossil-energy, and time. Battery recycling is impossible without oil. Air travel and commercial diesel requirements cannot possibly be met with electricity from renewables. Biofuels require massive inputs of fossil fuels, compete with food, and do not return nutrients and energy (like "humanure") to their origin.
Interest-driven investment is a questionable economic concept in the face of declining growth. Nothing of substance grows without energy. The end of cheap oil will begin the decline of all energy sources and infers that interest returned on principal is an illusion of monetary growth without commensurate, real, energy-driven, economic growth.
Alternative transportation proposals are unrealistic because there is no energy source including biofuels remotely close to oil that can support the liquid-fueled mobility we take for granted. Nor is there the wealth and time to support such a transition. Only oil can provide the unique energy source we take for granted as we take the energy supply on-board along with us as we travel. Air travel and personal motorized transportation only work because of the unique energy intensity of oil-derived fuels. In some places, electrified third rail public transportation may revive. But this will take time and investment. It is totally incompatible with the post WWII, gasoline-fueled exodus to the suburbs.
On-line shopping, daily mail delivery, and all forms of ubiquitous personal service depend on profligate oil consumption that cannot continue without cheap oil.
Infrastructure repair is a popular concept but is entirely dependent on energy, specifically the need for oil at less than $10 per barrel as was the case when the infrastructure was originally built.
Building construction and maintenance are totally dependent on inexpensive oil. Although not as urgent as food and transportation energy, both private and public buildings require energy, specifically oil, to provide the shelter we need and expect. Already, buildings in the poorer parts of the country are neglected as discretionary spending and taxes take lower priority to gasoline and growing trillions of dollars of consumer debt. In some parts of the country heating oil will no longer be an option. As the price of oil climbs, the cost to keep warm is added to gasoline for mobility. Both are examples of rapidly burning-through our most precious finite resource. We cannot revert to firewood (where available) without fuel for the chainsaw, skidder, or delivery truck.
Public services we took for granted in the past low-cost energy age will come under increased pressure. From local law enforcement to national security, we expect the protection of an oil-fueled civil society. Readily available hospital care and out-patient medical services are further examples of energy-intensive needs that depend on inexpensive oil. Public water and sewage disposal systems require readily available gasoline and diesel for maintenance and supply. Schools need liquid fuels for student transportation, teacher mobility, and building heat. A world wide air delivery postal service cannot return to the pony express and sailing vessels. Fire protection and first responder response absolutely run on gasoline and diesel fuel. The list goes on and on. Shouldn't we be saving our remaining oil for these civil necessities? Our society has grown and is totally dependent on liquid, but finite, fossil fuels. As previous President Bush said, "We are addicted to oil."
Welfare and entitlements cannot be provided without the underlying support of a growing population supported, as in the past, with abundant energy. Social Security, Medicare, and Disability Insurance are examples of the ubiquitous, comfortable safety nets we've come to expect in the oil age and continuing economic growth. As our population grows older, almost every health need will compete with the cost of oil just as it becomes less available and more expensive.
Transition towns and other proposals for local, self-sufficient economies cannot provide the basic industrial-age goods we expect from a vast capital-intensive integrated economy. Small details like disposable batteries, light bulbs, computers, solar-energy components, paper products, rechargeable batteries, and recycling all depend on fossil fuels for manufacture and shipping. In addition, small close-knit societies must respect the mathematical laws of inexorable population growth.
Recreational oil use is especially problematic. From powering a snowmobile to mass travel to a major sporting event, the oil we consume now will not be there for survival in the post-oil age. The fuel used for an internal combustion race of any type leaves less for growing food in the future.
Fighting mother nature consumes prodigious amounts of liquid fossil fuels. Every time there's a tornado, hurricane or snowstorm we expend prodigious quantities of liquid fuels to respond. The linked essay: "Winter in Maine" describes the annual battle in rural New England to keep us going, including ten gallons of diesel fuel per mile to plow snow. Will we even need to plow snow with no fuel for our cars?
Oil to support other energy sources. Coal cannot be mined and delivered without oil. Natural gas access and pipelines are directly dependent on oil. Nuclear plants and hydroelectric plants cannot be built and maintained without the oil necessary for a diesel-powered support system.
Oil to support other non-energy resources. All other finite resources we take for granted like steel, aluminum, and fertilizers, will decline despite a growing population. Notwithstanding less oil available for mining, there will be less available for future needs. The book, Scarcity, in the linked bibliography, describes this growing challenge in quantified detail.
WHERE DO WE GO FROM HERE
Clearly, we are a world-wide industrialized society that has grown in population and complexity only because of, and in lock-step with, the availability of cheap oil. One would think that human brains capable of inventing space travel and microchips would recognize the magnitude of the cliff we are now facing at the looming end of the oil age. Americans living on ten times the per capita oil as the world average have ten times farther to fall.
Many will argue that the resurgence in U.S. oil extraction and the lower price of oil is proof that the long-term reality of oil depletion will not happen. This narrative is especially dangerous because it encourages avoidance of the dire facts and changes we must make.
But all is not hopeless. First, the public needs to know the numbers and total story, hence the need for this web site to be forwarded in every and any way possible, by you! There is a desperate need for a focused, honest, apolitical leadership to tell truth. Arguably, in times of pending crisis, only a heroic autocratic figure could lead and teach why we must all expect gasoline rationing as a first step to mitigation. When urgent action is required, cumbersome, traditional forms of governance like a Democracy, Socialism, a political party system, or Communism cannot respond, especially if there is the tendency for every societal member to grab whatever possible for personal survival and perpetuation of a past energy-intensive lifestyle. When declining resources are overwhelmed by increasing demand, especially with ethnic or wealth disparity, survival trumps peaceful group response: "too many forks in a shrinking pie".
5. Solidarity, Subsidiarity, Sustainability, and Nonviolence
Transitioning from consumerism to sustainability will require shifting gears in many significant ways. The following principles will be instrumental in attaining the transition to clean energy.
"Solidarity is not a matter of altruism. Solidarity comes from the inability to tolerate the affront to our own integrity of passive or active collaboration in the oppression of others, and from the deep recognition of our most expansive self-interest. From the recognition that, like it or not, our liberation is bound up with that of every other being on the planet, and that politically, spiritually, in our heart of hearts we know anything else is unaffordable."
"Subsidiarity is an organizing principle that matters ought to be handled by the smallest, lowest or least centralized competent authority... A central authority should have a subsidiary function, performing only those tasks which cannot be performed effectively at a more immediate or local level... Subsidiarity is, ideally or in principle, one of the features of federalism, where it asserts the rights of the parts over the whole."
"Sustainability is the capacity to endure. In ecology, the word describes how biological systems remain diverse and productive over time. Long-lived and healthy wetlands and forests are examples of sustainable biological systems. For humans, sustainability is the potential for long-term maintenance of well being, which has environmental, economic, and social dimensions."
"Nonviolence has two (closely related) meanings. (1) It can refer, first, to a general philosophy of abstention from violence because of moral or religious principle (e.g. "She believes in nonviolence.") (2) It can refer to the behaviour of people using nonviolent action (e.g. "The demonstrators maintained their nonviolence.")
A shift is needed from consumerism and the profligate use of non-renewable energy resources to moderate use of renewable energy resources. Technologies to develop and deliver clean energy are readily available. But existing technologies, and improved ones to be developed, can make a positive contribution if, and only if, the human side of the equation (as outlined in the preceding sections) is taken care of.
SOLIDARITY, SUBSIDIARITY, AND SUSTAINABILITY IN TODAY'S WORLD
Continued use and abuse of non-renewable energy sources is unsustainable. In the long-term, renewable energy sources will be indispensable. Technologies are available (or can become available with appropriate incentives) that would make it possible to meet most human energy needs with clean energy by 2050. However, to make it happen is mainly a social issue, not a technical one. Most projections on energy supply and demand reflect a "business as usal" mindset that entails continuation of recent trends. For instance, consider the data and projections (left) from the International Energy Outlook (IEO) 2011, Energy Information Administration, US Department of Energy, September 2011. For a more comprehensive set of charts, see Energy Perspectives.
Most projections to 2050 and beyond suggest that, while energy demand will continue to grow, no significant shift from fossil fuels to renewables is to be expected. Indeed, the demand for fossil fuels is very inelastic; what other choice do people have as long as there are no clean energy alternatives?. But humans are bound to be affected by continued environmental deterioration and climate change, so the extrapolation of recent growth trends into the future does not bode well for either the future health of the planet or the wellbeing of humanity. Thus is the nature of an economic system in which short-term profits are the sole arbiter of production and consumption decisions.
Lurking under the rosy projections of global energy production and consumption is the implicit assumption that economic growth - in terms of production and consumption of material commodities - will continue to grow even if population stabilizes. Any other assumption would be "politically incorrect" and therefore ruled out. However, the energy return on energy investment (EROEI, or EROI), and therefore the financial return on investment, is much higher for non-renewables than for renewables, as shown in the chart inserted to the right. As long as this is the case, the worldwide carbon-based economic and financial systems - driven as they are to minimize "time to market" and maximize short-term profits "one quarter at a time" - are utterly unable to shift priorities from carbon-based growth to sustainable stability. As economist Milton Friedman has pointed out, "only a crisis - actual or perceived - produces real change. When the crisis occurs, the actions that are taken depend upon the ideas that are lying around. That, I believe, is our basic function: to develop alternatives to existing policies, to keep them alive and available until the politically impossible becomes politically inevitable." A compilation of such alternatives, by no means exhaustive or definitively integrated, is presented in Section 7.
"First released in 2005, REN21s Renewables Global Status Report (GSR) provides a comprehensive and timely overview of renewable energy market, industry, investment and policy developments worldwide. It enables policymakers, industry, investors and civil society to make informed decisions. The Renewables Global Status Report relies on up-to-date renewable energy data, provided by an international network of more than 500 contributors, researchers, and authors. Check out REN21s Renewables Interactive Map for country specific data underlying the various trends highlighted in the GSR."
"A new study by BCC Research finds that the global renewable energy market (excluding biofuels) reached $432.7 billion in 2013 and $476.3 billion in 2014. This market is expected to increase to $777.6 billion in 2019, with a compound annual growth rate (CAGR) of 10.3% from 2014 to 2019. The global hydroelectric technology market for renewable energy was valued at $298 billion in 2014 and is expected to grow at a CAGR of 7.2% from 2014 to 2019 to reach a value of $422.1 billion in 2019. In terms of revenue, the wind power market was valued at nearly $104.9 billion in 2014 and is expected to reach $180.1 billion in 2019, growing at a CAGR of 11.4% from 2014 to 2019."
7. Simulation Scenarios of the Transition to Sustainability
This section presents the emerging synthesis of all the information in sections 1 to 7. The synthesis is presented in the form of a concept that integrates the social, economic, and energy issues that must be resolved to attain a civilized (i.e., humane) transition during the first half of the 21st century. Energy balance for entropy control is a non-negotiable requirement, and gender balance for violence mitigation is an indispensable catalyst for the transition. The strategy is presented next from the process, time-phasing, and system perspectives:
INTEGRATED TRANSITION STRATEGY - PROCESS VIEW
The following is a conceptual diagram of the sustainable development process:
Bounded Population-Economic-Ecological System for Sustainable Human Development
Adapted from
Prosperity without Growth, Tim Jackson, 2011, Figure 12.1, Page 195
BASIC ARCHITECTURE FOR SDSIM 2.0
There are three sets of feedback loops: human development, human adaptation, and industrial mitigation. The human development loops (yellow arrows) improve gender equality and other human capabilities, and guide the allocation of income/commodities generated by the economic system. The human adaptation loops (red arrows) drive ecological investment so as to enhance the sustainability of ecosystem services. The industrial mitigation loops (green arrows) improve the productivity of energy and other resources by using "industrial engineering" methods. The working hypothesis is that mitigation loops are helpful as long as their operation is subservient to, and do not interfere with, the human development and human adaptation loops.
The convergence of gender balance, energy balance, and sustainability emerges from gender imbalance and energy imbalance jointly driving human civilization toward unsustainability. Many other factors are involved, but gender and energy imbalances are the most pervasive, and balancing them would have a neutralizing effect on all the other factors that conspire against a sustainable human society. If the transition from consumerism to sustainability is to be attained in a timely and civilized manner, i.e., before it is too late and minimizing violence as much as possible, balancing gender relations and energy flows would be the best (perhaps the only?) way to go.
INTEGRATED TRANSITION STRATEGY - PHASES VIEW
There are four phases: concientization, incentivation, redistribution, and democratization. Phases may overlap recursively. Time is of the esence, but the specifc start/end dates for the time windows are impossible to predict.
The following acronyms, and terminology are used in this transition concept and subsequent discussion:
Energy Return on Investment (EROI)
Energy return on Energy Investment (EROEI)
Financial Transaction Tax (FTT)
Global Citizens Movement (GCM)
Human Development (HD)
Human Development Index (HDI)
Human Development Report (HDR)
Integral Human Development (IHD)
International Standards Organization (ISO)
Land Value Tax (LVT) or Resource Value Tax (RVT)
Maslow's Hierarchy of Human Needs (MASLOW)
Non-Governmental Organization (NGO)
Principle of Solidarity (SOLIDARITY)
Principle of Subsidiarity (SUBSIDIARITY)
Principle of Sustainability (SUSTAINABILITY)
Sustainable Development (SD)
Sustainable Human Development (SHD)
Triple Bottom Line (TBL)
The formula I=PxAxT, known as "Ehrlich's Equation," is generally recognized as a good model for the ecological impact of economic activity. The impact is a nonlinear function of human population (P, # of persons), affluence (A) measured as consumption per capita ($/person), and a technology factor (T) that quantifies the impact (in physical units) per dollar of consumption. Note that for impact (I) to decrease, the technology factor (T) must go down faster than the product of population (P) and lifestyle (A) grows.
Several formulations are possible for IHD. The best known is the United Nations' Human Development Index (HDI) which includes three components: life expectancy, years of schooling, and GNP per capita. The are many variations of the HDI to include, for example, the gender equality dimension. Other indices attempt to replace GNP with other measures of human wellbeing, such as the Genuine Progress Indicator (GPI), the GINI Cofficient of Inequality, and the Happy Planet Index (HPI).
The transition entails maximizing human development and wellbeing as much as possible, and minimizing ecological impacts as much as possible, in a manner that leads to economic and ecological stability. Clearly, maximizing human wellbeing and minimizing ecological impact are mutually contradictory goals as long as human wellbeing is measured in terms of material consumption per capita. Since there are resource limits, and there are limits to efficiency improvements via technological innovation, something must give: humans must adapt by shifting expectations of wellbeing from economic affluence to other human development goals. It is impossible to predict how this adaptation process will unfold, but the following synopsis of the transition phases is proposed as a point of reference:
The first phase is concientization to enable incentivation. The objective is to create widespread popular support for the required revisions of tax codes and energy subsidies. In other words, the first phase is about creating a collective mindset of global citizenship and social responsibility, strong enough to translate into political will to face the inevitable transition and implement required reforms. Gender equity is key.
The second phase is incentivation to enable redistribution. The objective is to reform tax codes and energy subsidies to expedite the transition from fossil fuels to clean energy. Applicable reforms include shifting taxes from earned income to the usage (extraction) of unearned resources and the release of pollution, as well as taxing financial transactions of dubious social value. Gender equality is key.
The third phase is redistribution to enable democratization. The objective is to institutionalize democracy with gender balance and distributive justice. This may entail adopting a Universally Guaranteed Personal Income (i.e., a basic minimum income rather than a minimum wage) and a Maximum Allowable Personal Wealth (i.e., an upper limit on financial wealth accumulation) that can be democratically adjusted periodically.
The fourth phase is worldwide democratization. The objective is democratization of global, national, and local governance with deeply ingrained gender balance and widely institutionalized implementation of the solidarity, subsidiarity, and sustainability principles. Decisions are to be made at the lowest possible level consistent with governance capabilities and the common good of humanity.
The four phases are not envisioned to be strictly sequential. They most probably will overlap, with recursions and convulsions along the way. The term "gender equality" is not to be understood as "gender uniformity." By gender equality is meant equality of dignity and personal development opportunities across the entire gender continuum. In other words, full equality in all dimensions of human life: physical, intellectual, psychological, vocational, spiritual. The term "clean energy" is to be understood as "clean renewable energy" that is naturally replenished and does not produce GHG emissions when used. It does not include absurdities such as "clean coal." The combination of gender balance and energy balance is hereby proposed as the necessary and sufficient driver for a civilized (i.e., humane) transition, and are expected to have a multiplying effect throughout the global human system.
INTEGRATED TRANSITION STRATEGY - SYSTEM VIEW
SYSTEM VIEW OF THE SUSTAINABILITY PARADOX
The following diagram represents the present world human system:
THE SUSTAINABILITY PARADOX
The positive signs indicate positive (self-reinforcing) feedback loops
Based on the Ecocosm Paradox Diagram by Willard R. Fey & Ann C. W. Lam, 1999
The downward flow at the center is the flow (lifecycle) for all kinds of merchandise. The feedback loop on the right-hand side is the population growth process. The feedback loop on the left-hand side is the economic growth process. If human consumption keeps increasing, natural resources are depleted and pollution accumulates. If human consumption decreases/stabilizes, the current economic/financial system destabilizes/collapses. This is the "infinite growth in a finite planet" paradox, which is more commonly referred to as the "sustainable development" paradox or simply the sustainability paradox.
The connecting arrows in the diagram indicate a ceteris paribus direction of influence. In the current world system the sense of every influence is positive, i.e., "more" leads to "more." However, the strength of the influence may change with time depending on various factors. For instance, the strength of the influence from "General Human Wellbeing" to "Net Human Fertility" may decrease after a certain threshold of wellbeing, higher levels of education, and accesibility to reproductive heath care. The strength of the influence from "Material Human Comfort" to "Decisions to Borrow and Invest" may increase when lines of credit with low interest rates are easy to obtain.
SYSTEM VIEW OF THE SUSTAINABILITY PARADOX
WITH SUPERIMPOSED TRENDS
The following diagram represents the present world human system with samples of recent trend data for population, consumption, and the physical flows of energy and materials:
THE SUSTAINABILITY PARADOX WITH SUPERIMPOSED TRENDS
World Population 1950-2100 (UNDATA, 2010 Revision)
World Consumption Per Capita 1965-1995 (World Bank, 2011)
World Human Consumption 1960-2009 (World Bank, 2011)
World Energy Consumption 1990-2035(DOE EIA, IEO 2011)
World Average Land Surface Temperature 1800-2005 (Berkeley Earth, October 2011)
At the moment, the world's population is approximately 7 billion people but the rate of growth is slowing down. Global consumption of goods and services is approaching 60 trillion dollars, with 80% of commodities going to 20% of the population. Empirical data shows that consumption is growing faster than population, even though over one billion people remain in abject poverty. The global financial system is in total disarray. Worldwide, the rich-poor gap is increasing increasingly. Billions of tons of minerals and fossil fuels are being extracted from the earth each year, and billions of tons of waste and pollutants are being dumped back into the environment. Climate change, induced by global warming, is already impacting some human communities. Specific numbers are important, but recent growth patterns and their projected continuation are the main concern. It is impossible to predict the timing of forthcoming events, but it is reasonable to anticipate that infinite material growth in a finite planet is a mathematical impossibility.
The above hypothesis on how economic growth dynamics unfold can be refined in many different ways. For instance, the following diagram includes only the economic growth loops (left portion of the diagram) to show additional investment loops on financial credit, job creation, technology development, and advertising. Now we have a multiplicity of positive feedback loops that reinforce each other and jointly reinforce human consumption, as in the following diagram:
SYSTEM VIEW OF THE SUSTAINABILITY PARADOX
WITH MULTIPLE ECONOMIC GROWTH & JOB CREATION LOOPS
The following diagram represents the present world human system with added detail on job creation in conjunction with the economic growth process:
THE SUSTAINABILITY PARADOX WITH MULTIPLE ECONOMIC GROWTH & JOB CREATION LOOPS
Another way to expand the hypothesis is by including the financial growth loops whereby banks lend to industry and, in addition, lend to investors seeking financial gain for the sake of financial gain (i.e., nothing is produced or consumed). Such is the case, for example, when investor A borrows money from bank X at a given interest rate, then lends the money to investor B at a higher interest rate and pockets the additional gain. This kind of financial speculation activity (which is perfectly legal and facilitated by currencies no longer being under the gold or some other tangible resource standard) that may lead to financial bubbles and crises as happened recently in the USA and more recently in Europe. Consider the following diagram:
SYSTEM VIEW OF THE SUSTAINABILITY PARADOX
WITH MULTIPLE FINANCIAL GROWTH LOOPS
The following diagram represents the present world human system with added detail on the financial dimension of the economic growth process:
THE SUSTAINABILITY PARADOX WITH MULTIPLE FINANCIAL GROWTH LOOPS
There is empirical evidence that total world population is now increasing decreasingly, so current economic conditions suggest focusing on the economic side of the sustainability paradox. The economic growth process is driven by growing consumer demand for additional material comfort in the form of goods and services. This induces decisions to invest for expansion of industrial capacity, new technologies, and more advertising. Banks reinforce investment by lending to investors, and also by lending to consumers eager to increase their per capita consumption, which is currently growing faster than population. Since the dollar and other currencies are no longer based on gold, banks also can lend for trading in derivatives and other "financial weapons of mass destruction." This unbriddled capital accumulation process, driven by short-term profits and a systematic discounting of the future, assumes that there can be infinite growth in a finite planet, and actually requires continued and unlimited growth to keep functioning. This is the essence of the sustainability paradox.
SYSTEM VIEW OF THE SUSTAINABILITY PARADIGM
The following diagram represents the future world human system:
THE SUSTAINABILITY PARADIGM
The positive signs indicate positive (self-reinforcing) feedback loops
The negative signs indicate negative (self-correcting) feedback loops
The new connectors at the top linking natural resources to population and consumption per capita create adaptation loops (dotted lines). As long as natural resources are not limiting, these loops remain inactive. When one or more natural resources (e.g., minerals, water, fossil fuels) become limiting, resource prices are bound to increase and adaptation must take place by limiting population growth, economic growth, or both. On the economic side, this entails reducing consumption, substituting one resource by another, or both.
The new connectors at the bottom linking waste/pollution accumulation to human comfort (material or otherwise) are mitigation loops (dashed lines). As long as environmental degradation does not affect human comfort, these loops remain inactive. When the accumulation of pollutants is such that human well-being (material comfort, health, etc.) is impacted, the costs of environmental remediation are bound to increase and mitigation must take place by shifting priorities from comfort to survival.
SYSTEM VIEW OF THE SUSTAINABILITY PARADIGM WITH EMBEDDED INPUT-OUTPUT MATRIX
The following diagram represents the future world human system enhanced to show the vector of resource intensities, the matrix of inter-industry transactions, and the vector of emission factors:
THE SUSTAINABILITY PARADIGM WITH EMBEDDED INPUT-OUTPUT MATRIX
The positive signs indicate positive (self-reinforcing) feedback loops
The negative signs indicate negative (self-correcting) feedback loops
Intensity factors are in resource input units per unit of merchandise produced
The input-output matrix is the Leontief matrix of interindustry transactions
Emission factors are in emission output units per unit of merchandise consumed
When the mitigation and adaptation loops are activated, analysis of possible trade-offs and substitutions will require an embedded inter-industry transactions matrix. How specificity of the analyzable trade-offs will be contingent on the granularity of industry decomposition captured by the input-output matrix. For instance, the North American Industry Classification System (NAICS) divides GDP into 24 major industry sectors which in turn are decomposed into a total of 2228 industries. The web-based Economic Input-Output Life Cycle Assessment (EIO-LCA) at the Green Design Institute, Carnegie Mellon University, divides GDP into 27 "broad sector groups," each further decomposed into a number of "detailed sectors." See also the System of National Accounts (SNA), United Nations, 2009.
SYSTEM VIEW OF THE SUSTAINABILITY PARADIGM WITH PROPOSED
RESOURCE VALUE TAXES (RVT) AND FINANCIAL TRANSACTION TAXES (FTT)
The following diagram represents the future world human system further enhanced to show self-correcting environmental and financial management loops:
THE SUSTAINABILITY PARADIGM WITH ENVIRONMENTAL & FINANCIAL LOOPS
The positive signs indicate positive (self-reinforcing) feedback loops
The negative signs indicate negative (self-correcting) feedback loops
Resource Value Taxes (RVT) are a function of natural resource depletion/deterioration
Financial Transaction Taxes are a function of RVT and the volume of non-real financial assets
RVT and FTT serve to reinforce job creation and employment opportunities
The formulation of adaptation and mitigation policies will attempt to integrate several dimensions of scientific knowledge and human experience, including gender equality issues, in order to simulate some plausible (but by no means predictive) transition scenarios and trade-offs. For a detailed list of supporting references click here. Nothing is totally unrelated to sustainable human development, and there are many variations of any conceivable transition scenario. Some of the variations to be investigated are identified in the following section.
SDSIM 2.0 ARCHITECTURE
The architecture of SDSIM 2.0 integrates the sustainability paradox into the transition strategy:
SDSIM 2.0 ARCHITECTURE (WORK IN PROGRESS)
P1, P2, and P3 are the positive population-industrial-financial loops
which currently drive the sustainable development ("infinite growth") paradox
E1, E2, and E3 are negative energy production-consumption and behavioral loops, and
AMD stands for human adaptation-mitigation decisions in response to energy availability constraints
This architecture is proposed as the simplest possible model to capture both the positive (self-reinforcing) feedback loops of the growth paradox and the negative (self-regulating) feedback loops that are bound to emerge during the transition. It is anticipated that dominance will gradually (or not so gradually) shift from the P loops to the E loops as the transition unfolds. The E loops can be generalized to include natural resources other than energy, but energy is the primary concern for SDSIM 2.0. Consideration of other resources, such as water and minerals, is planned for subsequent revisions of the architecture (SDSIM 2.1, 2.2, etc.). AMD is a function of material consumption, financial gain, and energy scarcity and serves to calculate the adaptation and mitigation decisions that are forced by economic and energy constraints. The inverse of AMD is being investigated as a possible model of social cohesion, or the collective capacity to make adaptation and mitigation decisions motivated by human development incentives as opposed to biophysical constraints.
It is critical to take explicitly into account how people and governments will behave in response to changes in the mix of financial profitability and energy availability. What function could be used to model of how people will react to changes in financial profitability and energy scarcity in a given solidarity-sustainability culture? What would be the consequences for population growth (or decline), economic growth (or decline) and quality of life during the transition from consumerism to sustainability? These are the kind of questions to be investigated (via simulation experiments) with SDSIM 2.0. It is understood that social systems are more than closed-loop feedback structures no matter how highly refined the mathematical equations and parameter values. The intent of the SDSIM project is not to provide any final answers but simply to contribute, in some small way, to define more precisely the key questions that must be answered, in a broader context of practicality and wisdom, in order to attain the transition and avoid, to the extent possible, unnecessary human suffering in the process.
SOME PRELIMINARY SIMULATIONS
The current SDSIM 2.0 is a demo, not a capability. For instance, the graph below is a simulation of world population, gross industrial production, average consumption per capita, energy availability, and social cohesion ("solidarity index") trends, during 200 years (1900-2100):
Sustainable Development Simulation (SDSIM 2.0) from 1900 to 2100
This simulation suggests that, toward the end of the 21st century, population and social cohesion are declining while GDP and per capita consumption are still rising even as energy availability is peaking. Is this leading to a steady-state economy at high levels of production and consumption? The next graph shows the same system simulated during 1000 years (1900-2900, as shown in the horizontal axis):
SDSIM 2.0 BASELINE SCENARIO
Sustainable Development Simulation (SDSIM 2.0) from 1900 to 2900
Due to significant time delays in adjusting population growth and resource consumption rates, and further delays in developing new technologies to "do more with less," the system goes into an extended period of oscillations in population and consumption levels. The amplitude of the oscillations seems to be gradually declining toward new steady-state levels of population and consumption, but at the expense of significant decline in social cohesion (fierce competition over increasingly scarce energy resources?). However, toward the end, drastic adjustments are induced by energy availability returning to the pre-1900 level, i.e., after a very long tail, all fossil fuel resources are finally exhausted.
Extending the simulation for another 1,000 years (next plot), the calculations suggest that another transition would be needed before long-term stability is attained:
Sustainable Development Simulation (SDSIM 2.0) from 1900 to 3900
Beyond 2100, it would seem that the system is leading to steady-state albeit via a long series of oscillations of decreasing amplitude. However, after 2800 or so, energy availability is depleted to just above the 1900 level, or basically solar influx plus of minimum amount of energy from remaining fossil sources. Then, even if massive starvation is avoided by human adaptation, the system adjusts down to a much lower steady-state in terms of population, economic throughput, and "standard of living." Time will tell whether this will make social cohesion decline even further, or eventually induce a much higher level of solidarity (human capacity for virtue out of necessity?) as suggested by the simulation. It cannot be overemphasized that this is a simulation, not a prediction. The simulation simply shows that eventually the system must go back to an energetically sustainable steady-state.
SUMMARY OF BASELINE SCENARIO
This is a simulated scenario, not a prediction. It portrays dynamic modes of behavior that can be expected during the transition from consumerism to sustainability. Both simulated time (horizontal axis) and simulated variables (vertical axis) can be adjusted without changing the fundamental patterns of growth, oscillations, and degrowth. During the transition, undoubtedly there will be noise due to short-tem social, economic, and ecological perturbations, but the overall patterns of peaks and valleys will persist in the long-term, as follows:
Population peaking, then oscillating and finally decreasing to a long-term sustainable level. Note time-phasing with GDP and per capita consumption of material goods and services.
The peak in energy availability is followed by a long decline until it settles to the steady-state flow that is allowed by solar (and perhaps other cosmic) sources of energy. The "long-tail" is the result technological developments with gradually decreasing return on energy invested.
The solidarity index is currently formulated as a nonlinear function of human population, material consumption, and energy flows. It is an indicator of social cohesion, which is tightly coupled with the sustainability of resource usage. Solidarity reinforces sustainability and vice versa.
The general patterns of peaks, oscillations, and eventual settling to steady-state are indicative of turbulence during the transition, with high risk of cultural disruptions and violence. The myth of "infinite growth in a finite planet" will not be easy to overcome.
This is not intended to be an "alarmist" scenario. However, it would be wise to take the Precautionary Principle into account when formulation sustainable development policies as we enter the Anthropocene Age.
The past cannot be changed, and the future is unknown. The exact sequence and timing of events cannot be predicted, but the general transitional patterns can be anticipated on the basis of energy biophysics. Specifically, there is empirical evidence to the effect that:
1. Fossil fuel resources are high in energy content but are not infinite.
2. Fossil fuel emissions are environmentally detrimental and/or potentially unsafe.
3. Currently known clean energy alternatives offer relatively low energy content.
Given that fossil fuels are being depleted, pollution levels are damaging the environment, and clean energy alternatives may not provide enough energy to sustain industrial economies, is it wise to just continue doing "business as usual" and trusting that some earthshaking technological breakthrough will come to pass soon enough? Is it fair for people in the "developed" nations to keep indulging in energy consumption and waste while one billion people must subsist on $2 per day or less? How will population growth rate and per capita consumption change in response to impending resource constraints? Will demographic and consumption adjustments be voluntary or involuntary? If they are involuntary, there is a high risk of violence emerging in conjunction with fierce competition for resources throughout the world. Is this "the future we want"?
Modeling and simulating the basic variables shown above is not easy but is feasible (as forty years of Limits to Growth analysis has amply demonstrated), and it is self-evident that natural resources (energetic and otherwise) currently being used are not infinite. It is also possible to quantify other physical variables such as polluting emissions, food availability, etc. The big challenge is to formulate mitigation and adaptation decision functions (the AMD node in the architecture diagram) that could reasonably mimic some plausible ways in which human behavior might change as quality of life is impacted and resource scarcities cannot be ignored any longer. Needless to say, the intent is not to be predict but "simply" to analyze, hopefully in a way that yields some useful insight. Easier said than done, as complex financial and cultural factors will come into play.
The Human Development Index, the Environmental Performance Index, the Ecological Footprint, and other such metrics, are useful in the sense that they show the social and ecological impacts of past human decisions. However, they do not take into account how human behavior might change in response to forthcoming dynamics of the transition from consumerism to sustainability. It remains to be seen whether or not such functions can be formulated in a way that is reasonable and useful to enlighten the discussion.
INTEGRATION OF SUSTAINABLE DEVELOPMENT AND CLIMATE DYNAMICS
It is becoming increasingly clear that anthropogenic climate changes may be a critical factor forcing human behavior changes during the transition from consumerism to sustainability. A comprehensive model should, therefore, integrate the human and climate systems. In terms of feedback loop structures, the following series of articles may provide a basis for such enhancement of the simulations:
8. Variations of the Integrated Transition Strategy
In terms of the transition from fossil fuels to clean energy, there seems to be a convergence of outlook that is shared by business, agencies, and NGOs. This convergence is reflected in the UN IEA and US EIA scenarios. However, in terms off replacing fossil fuels with clean energy is a post-carbon world, the Paul Chefurka's scenario is the most "pessimistic" and Stuart Staniford's scenario is the most "optimistic." Actually, it is not a matter of being optimistic or pessimistic. The divergence between "best case" and "worst case" scenarios may be due different sets of explicit
assumptions about the timing of supply peaks for non-renewables and ramping up capacities for renewables plus different sets of implicit assumptions about human behavior and policy decisions in the context of an exceedingly complex system. Energy in some form is behind everything that moves, and there are many moving parts in industrial economies.
In their recently published book, Energy and the Wealth of Nations, Hall and Klitgaard point out that discrediting economic theories that have served us well in the past serves no purpose. It is not a matter of choosing between classical economics, or neoliberal economics, or behavioral economics, or ecological economics, or biophysical economics. But, as they also point out, it is the separation of the biophysical and social dimensions of economics that renders either one useless in confronting newly emerging issues at the intersection of human behavior and physical flows. In every case, however, energy flows are the point of intersection between the behavioral and the physical dimensions, and it could well be that "economic energetics" is the key for integrating both and developing a new synthesis, as proposed long ago by (among others) economist Nicholas Georgescu-Roegen and ecologist Howard T. Odum. In this regard, the "ecological economics" synthesis of Herman Daly deserves especial mention. Hall & Klitgaard's contribution is to isolate energy flows as the focal point for analysis (and hypothesis testing) via the "Energy Return on Investment" (EROI) index.
For the current level of climate change mitigation technologies, it would seem that Staniford's scenario is too optimistic in assuming that the production of fossil fuels can be sustained and the planet can absorb the resulting accumulation of GHG emissions without potentially catastrophic climate disruptions. On the other hand, Chefurka's scenario may be too pessimistic and hopefully will not come pass as the human-impact implications would be severe. EIA's scenario seems to be the most plausible with current technologies and economic conditions. However, the emergence of radically new and economically feasible technologies cannot be ruled out, and there is always the need to plan for the worst case scenario. With this range of scenarios in mind, the following variations are being considered for modeling and analysis:
Variations in the desired "Quality of Life"
Variations in the perceived value of human solidarity
Variations in the perceived value of ecological sustainability
Variations in the combined value of human solidarity and ecological sustainability
Variations in the timing and duration of human adaptations
Variations in the human propensity to consume (volume, choices, fix vs replace
Variations in the human propensity to adapt (climate, migration, transportation)
Variations in the pace of progress in secular gender equity, equality, and balance
Variations in the pace of progress in religious gender equity, equality, and balance
Variations in the adaptability of the world financial system (speculation, regulation)
Variations in the resilience of the human habitat (pollution, climate, ecosystem services)
Variations in fossil fuel reserves and the timing of "peak oil"
Variations in the timing and intensity of climate changes
Variations in the performance, schedule, and cost of clean energy technologies
Variations in the EROI values of non-renewable and renewable energy sources
Variations in the EROI values for resource discovery
Variations in the EROI values for resource development
Variations in the EROI values for resource extraction
Variations in the EROI values for resource conversion during production
Variations in the EROI values for resource conversion during consumption
Variations in the EROI values for resource conversion during disposal
Variations in the EROI values for resource emissions during production
Variations in the EROI values for resource emissions during consumption
Variations in the EROI values for resource emissions during disposal
Given the complexity and nonlinearity of complex ecological-economic systems, computer simulation methods are more promising for the analysis of dynamic modes of behavior related to both the "sustainability paradox" and the "sustainability paradigm" systems are diagrammed above. However, input-output analysis could be very useful to calculate specific interindustry propagations of energy resource substitutions within paradox/paradigm scenarios.
EDITOR'S NOTE: These variations are to be formulated and explored with SDSIM 2.0 (to view SDSIM 1.5, click here).
What will the world look like in the year 2030? The Trend Compendium 2030 by Roland Berger supports corporate strategists and top executives as they try to answer this question. We have conducted global research, analyzed extensive data sets and interpreted the findings. We have found seven megatrends that will shape the world of tomorrow.
The global megatrends report assesses 11 global megatrends (GMT) of importance for Europes environment in the long term. In assessing key drivers, trends and implications for Europe, it aims to provide an improved basis for strategic European environmental policymaking.
Future State 2030 is the first in a series of important conversations that we want to have with government organizations over the next few years. These pages identify nine global megatrends that are most salient to the future of governments. While their individual impacts will be far-reaching, the trends are highly interrelated and thus demand a combined and coordinated set of responses.
GLOBAL MEGATRENDS:
Global megatrend #1: Demographics
Global megatrend #2: Rise of the individual
Global megatrend #3: Enabling technology
Global megatrend #4: Economic interconnectedness
Global megatrend #5: Public debt
Global megatrend #6: Economic power shift
Global megatrend #7: Climate change
Global megatrend #8: Resource stress
Global megatrend #9: Urbanization
Annual Energy Outlook 2015 EIA Releases Energy Forecast Through 2040 U.S. Energy Information Administration
Projections in the Annual Energy Outlook 2015 (AEO2015) focus on the factors expected to shape U.S. energy markets through 2040. The projections provide a basis for examination and discussion of energy market trends and serve as a starting point for analysis of potential changes in U.S. energy policies, rules, and regulations, as well as the potential role of advanced technologies.
Key results from the AEO2015 Reference and alternative cases include the following:
The future path of crude oil and natural gas prices can vary substantially, depending on assumptions about the size of global
and domestic resources, demand for petroleum products and natural gas (particularly in non-Organization for Economic
Cooperation and Development (non-OECD) countries), levels of production, and supplies of other fuels. AEO2015 considers
these factors in examining alternative price and resource availability cases.
Growth in U.S. energy productionled by crude oil and natural gasand only modest growth in demand reduces U.S. reliance on imported energy supplies. Energy imports and exports come into balance in the United States starting in 2028 in the AEO2015 Reference case and in 2019 in the High Oil Price and High Oil and Gas Resource cases. Natural gas is the dominant U.S. energy export, while liquid fuels [4] continue to be imported.
Through 2020, strong growth in domestic crude oil production from tight formations leads to a decline in net petroleum imports [5] and growth in net petroleum product exports in all AEO2015 cases. In the High Oil and Gas Resource case, increased crude production before 2020 results in increased processed condensate[6] exports. Slowing growth in domestic production after 2020 is offset by increased vehicle fuel economy standards that limit growth in domestic demand. The net import share of crude oil and petroleum products supplied falls from 33% of total supply in 2013 to 17% of total supply in 2040 in the Reference case. The United States becomes a net exporter of petroleum and other liquids after 2020 in the High Oil Price and High Oil and Gas Resource cases because of greater U.S. crude oil production.
The United States transitions from being a modest net importer of natural gas to a net exporter by 2017. U.S. export growth continues after 2017, with net exports in 2040 ranging from 3.0 trillion cubic feet (Tcf) in the Low Oil Price case to 13.1 Tcf in the High Oil and Gas Resource case.
Growth in crude oil and dry natural gas production varies significantly across oil and natural gas supply regions and cases, forcing shifts in crude oil and natural gas flows between U.S. regions, and requiring investment in or realignment of pipelines and other midstream infrastructure
U.S. energy consumption grows at a modest rate over the AEO2015 projection period, averaging 0.3%/year from 2013 through 2040 in the Reference case. A marginal decrease in transportation sector energy consumption contrasts with growth in most other sectors. Declines in energy consumption tend to result from the adoption of more energy-efficient technologies and existing policies that promote increased energy efficiency.
Growth in production of dry natural gas and natural gas plant liquids (NGPL) contributes to the expansion of several manufacturing industries (such as bulk chemicals and primary metals) and the increased use of NGPL feedstocks in place of petroleum-based naphtha [7] feedstocks.
Rising long-term natural gas prices, the high capital costs of new coal and nuclear generation capacity, state-level policies, and cost reductions for renewable generation in a market characterized by relatively slow electricity demand growth favor increased use of renewables.
Rising costs for electric power generation, transmission, and distribution, coupled with relatively slow growth of electricity demand, produce an 18% increase in the average retail price of electricity over the period from 2013 to 2040 in the AEO2015 Reference case. The AEO2015 cases do not include the proposed Clean Power Plan.[8]
Improved efficiency in the end-use sectors and a shift away from more carbon-intensive fuels help to stabilize U.S. energy-related carbon dioxide (CO2) emissions, which remain below the 2005 level through 2040.


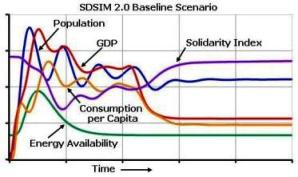 Solidarity reinforces Sustainability and vice versa
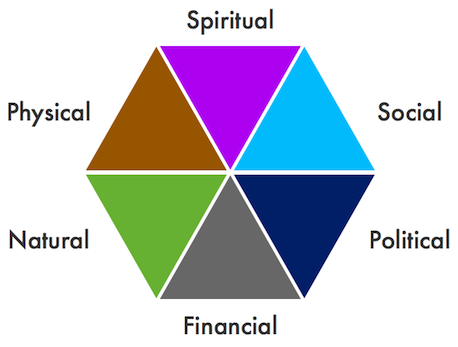
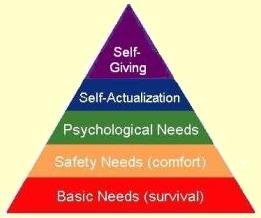
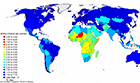

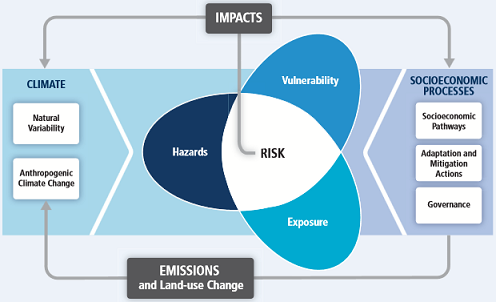
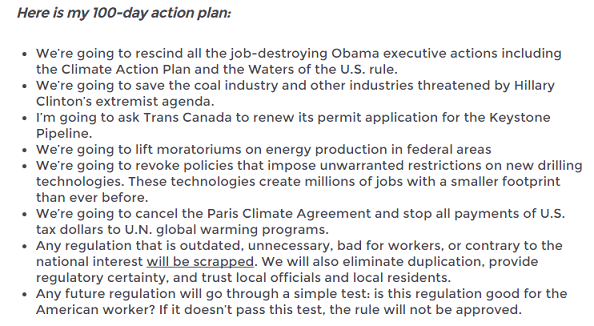

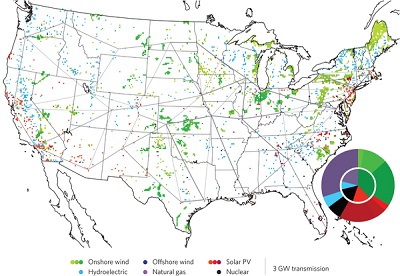
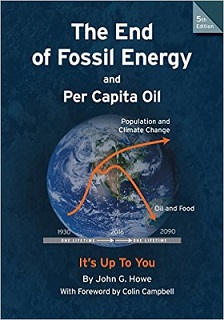


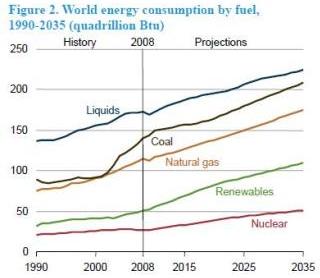
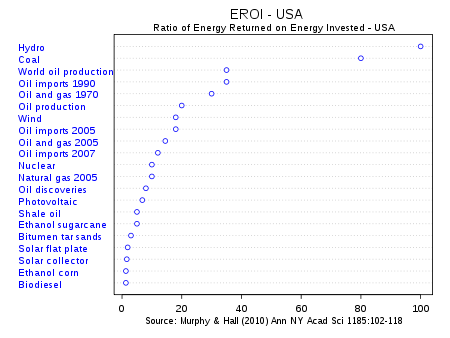

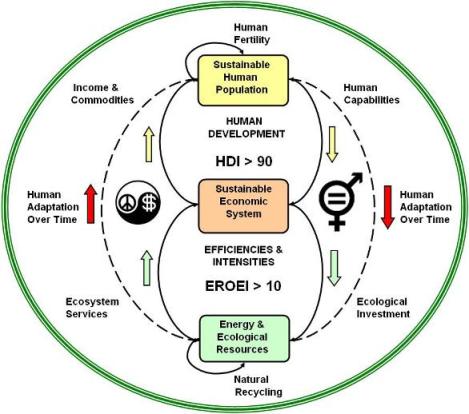
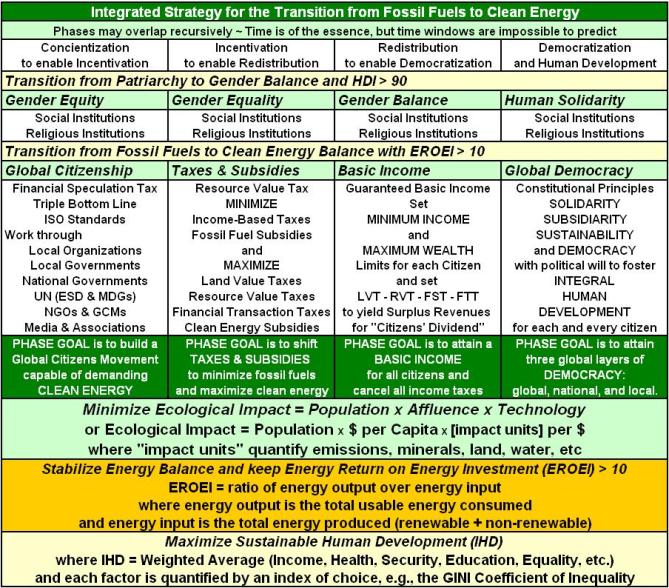
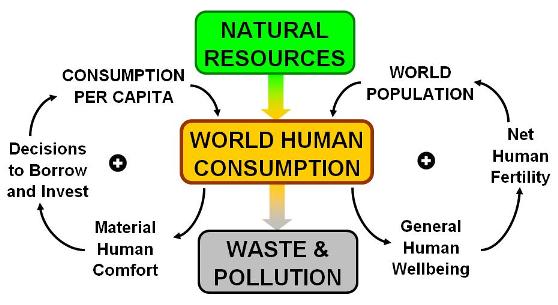
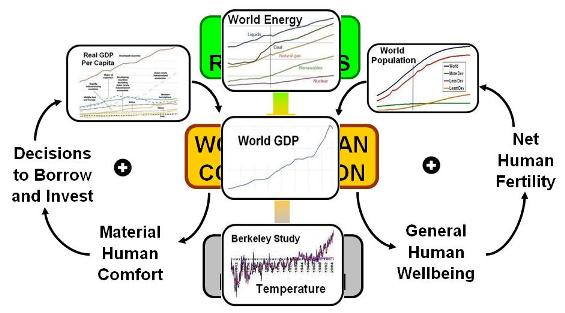
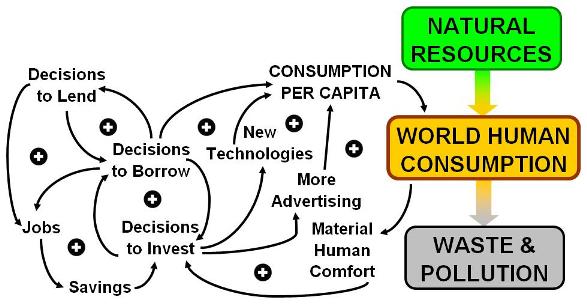
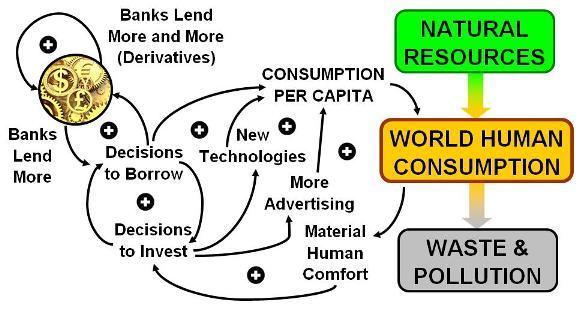
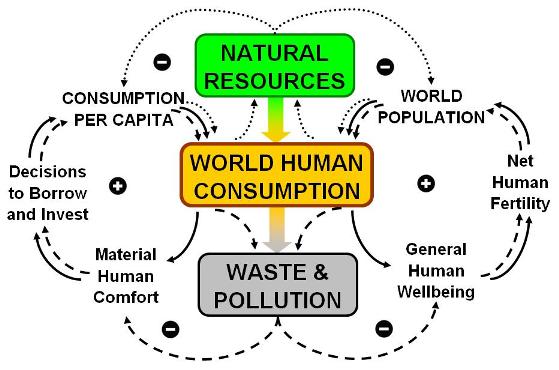
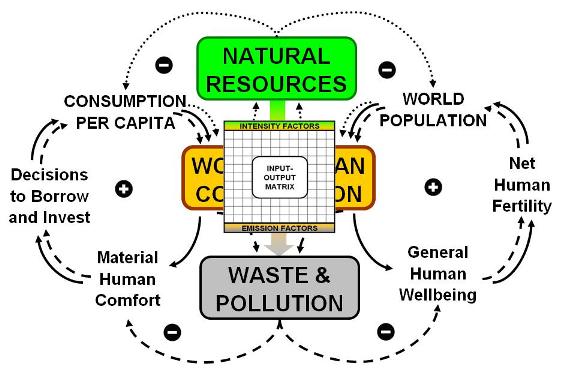
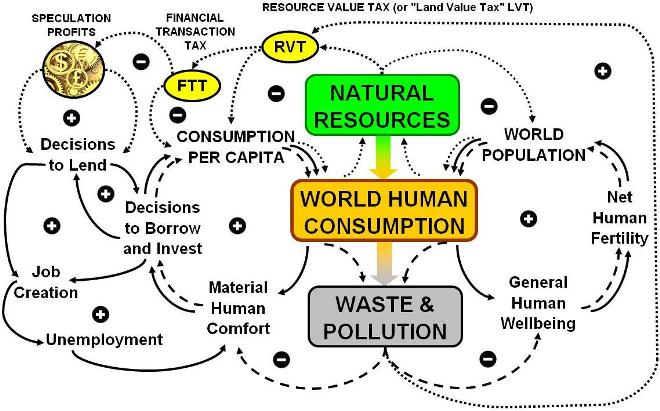
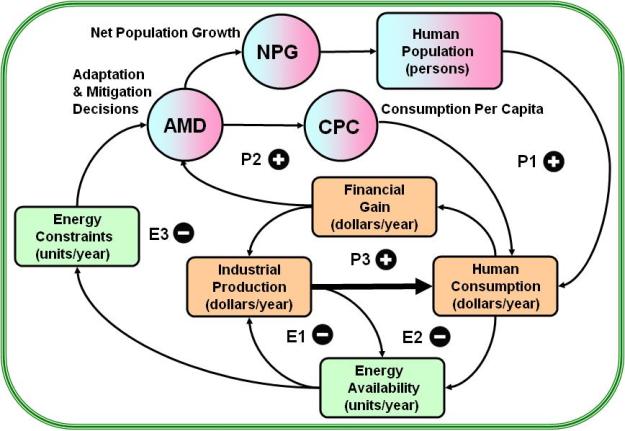
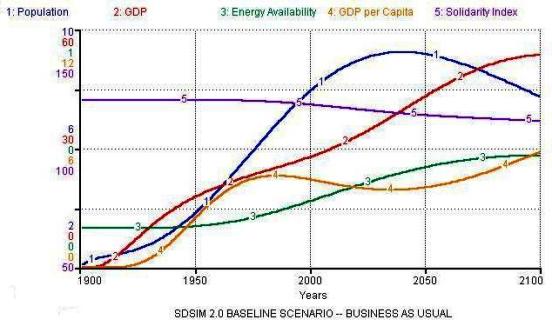
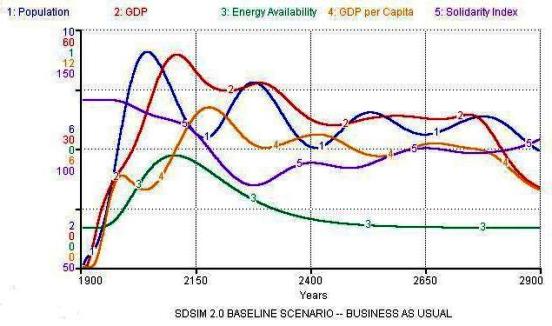
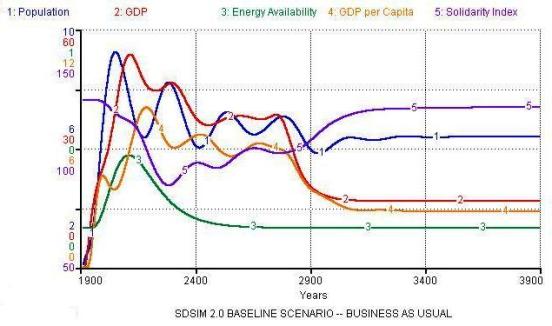


![[groups_small]](groups_small.gif)