Simulation Scenarios of the Transition to Sustainability
The key working hypothesis is that the transition from consumerism to sustainability will revolve around the transition from fossil fuels to clean energy, and this transition will come to pass whether we like it or not. However, the amount of human suffering during this process will depend on human adaptability and social cohesion. The simulations are not meant to be predictive but to show a range of plausible scenarios.
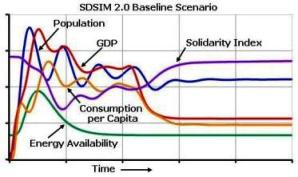
Solidarity reinforces Sustainability and vice versa
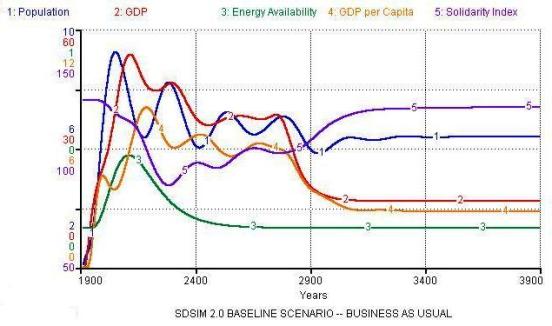
The horizontal and vertical scales are not shown in order to avoid giving the impression that this is a prediction. This is a simulated scenario, not a prediction. It portrays dynamic modes of system behavior that can be expected during the transition from consumerism to sustainability, as follows:
~ Population, production, and consumption peak, stagnate and/or oscillate with downward trend, and eventually decrease to long-term sustainable levels.
~ The peak in energy availability is followed by a long decline until it settles to the steady-state flow that is allowed by solar (and perhaps other cosmic) sources of energy.
~ The solidarity index is an indicator of social cohesion, which is tightly coupled with the sustainability of resource usage.
This is not intended to be an "alarmist" scenario. However, it would be wise to take the Precautionary Principle into account when formulation sustainable development policies as we enter the Anthropocene Age. Widespread violence is bound to emerge if demographic and consumption adjustments are to be made involuntarily. Is this "the future we want" for the entire community of nations? NB: The current SDSIM 2.0 is a demo, not a capability.
Human Development, the 2030 Agenda and the SDGs: How are they Connected?
Selim Jahan
Originally published in Human Development Today Human Development Report Office, UNDP September 2016 under a Creative Commons License
This month marks the first anniversary of the 2030 Agenda and the 17 Sustainable Development Goals (SDGs), agreed at a historic UN summit in New York. As SDGs inform the development discourse around the world, how can human development and Human Development Reports contribute to it? In this video, Selim Jahan, Director of the Human Development Report Office explains the links between human development and the 2030 Agenda and the SDGs, and reflects upon how Human Development Reports can make an intellectual contribution that helps to ensure that no one is left behind.
Selim Jahan, Director of the UNDP Human Development Report Office, talks bout the existing linkages between human development and the 2030 Agenda and how will Human Development Reports influence the development discourse in the next 15 years:
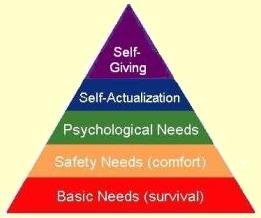
Maslow's Hierarchy of Human Needs
Adapted from Wikipedia
As a matter of principle, any strategy for the transition to clean energy must recognize integral human development as the most fundamental requirement to guide both public and private initiatives. Integral human development builds on respect for human rights and diligence on human duties, both individually and institutionally. A fundamental document is The Universal Declaration of Human Rights, approved by the United Nations General Assembly on 10 December 1948.
Hierarchy of Human Needs
Abraham Maslow (USA, 1908-1970) created the "hierarchy of human needs" in the 1940s. Maslow's model explicitly takes into account the physiological, safety, emotional, love/belonging, esteem/self-esteem, and self-actualization stages of integral human development. The hierarchy of human needs is usually represented as a pyramid, with the most basic needs at the bottom and the socialization needs at the top. There are many variations of the pyramid: one is shown to the right and others can be easily found. Going upward, the progression for each human being is to satisfy (1) the basic physical and physiological needs, (2) the need for safety and security, (3) the need psychological well-being, (4) the need for self-actualization (self-esteem, social responsibility), and (5) self-giving to others, or at least the desire to seek the common good in conjunction with legitimate self-interest. For further discussion of Maslow's "levels of human development" - and other models of human development - the reader is referred to the May 2010 issue of Mother Pelican. Attaining a culture of solidarity and sustainability is practically impossible under level 3, and generally requires level 4. This means that enabling people "to live to their full potential" requires, beyond meeting basic physical needs, access to educational and job opportunities as well as freedom for each person follow their "vocation" in life under conditions of human solidarity, social justice, and ecological sustainability. It is becoming increasingly difficult to provide such opportunities in the context of current population growth trends.
"The current world population of 7.3 billion is expected to reach 8.5 billion by 2030, 9.7 billion by 2050, and 11.2 billion in 2100, according to a United Nations report released today. The revised U.N. estimates counter previous projections, which had said that global population would peak at roughly 9 billion by 2050, then gradually decline. Most growth will occur in developing regions, the new report says, especially Africa, which is expected to account for more than half of the worlds population growth between 2015 and 2050. India is expected to become the most populous country, surpassing China around 2022. Nigeria could surpass the United States by 2050, which would make it the third-largest country in the world, the U.N. projects. The concentration of population growth in the poorest countries presents its own set of challenges, making it more difficult to eradicate poverty and inequality, said John Wilmoth, a director in the U.N.s Department of Economic and Social Affairs." Source: Environment 360, Yale University, 29 July 2015
The Congo Basin rainforest in West Africa is one of the biodiversity hot spots that face increasing pressure from human impacts. (Severin Stalder via Wikimedia Commons)
Foresters, geographers and ecologists have some good news. Although human population growth between 1992 and 2009 was 23%, and the global economy grew by 153%, the devastation to habitats, ecosystems and wilderness increased by only 9%.
But this single ray of good cheer is countered by a bleak warning from the same scientists that threequarters of the planets land surface is experiencing measurable human pressures.
And although the scientists found that the footprint of humanity has not grown to the same scale as the mass of humans and their goods and chattels, they report in Nature Communications that pressures are perversely intense, widespread and rapidly intensifying in places with high biodiversity.
The studys lead author, Oscar Venter, a forest scientist at the University of Northern British Columbia, says: Seeing that our impacts expanded at a rate that is slower than the rate of economic and population growth is encouraging. It means we are becoming more efficient in how we use natural resources.
Pioneering study
The human footprint is ecologists shorthand for the impact humanity makes on the natural worldthe growth of towns and cities, mines, smelting works, power stations, and the conversion of what would once have been savannah, wetland or forest.
The first pioneering study of the human footprint was based on data from the 1990s and published in 2002. Dr Venter and his colleagues looked at data for the built environment, roads, crops, pasture, night lighting, railways, navigable waterways and human population density to measure the subsequent pattern of impact.
In 1993, there were areas of no measurable human footprint over 27% of the continents, other than the Antarctic. In the subsequent decades, humans encroached onto 23 million square kilometres of these once-empty plains and forests.
Our maps show that 97% of the most species-rich places on Earth have been seriously altered.
The remaining pressure-free lands, the researchers write, are in the boreal and tundra regions, the Sahara, Gobi and Australian deserts, and the remote moist forests of the Congo and Amazon basins.
Worryingly, regions with the highest biodiversity were also associated with the highest levels of human pressure.
The scientists zeroed in on the detail, and examined 772 ecoregionsincluding Canadian aspen forests, peninsular Malaysian montaine rainforest, Belizean pine forest, Baffin coastal tundra, and New Guinea mangrovesin the map of natural terrestrial habitats.
Only 3% of these registered a decline in human pressure, which increased by more than 20% in 71% of the rest,
Our maps show that threequarters of the planet is now significantly altered and 97% of the most species-rich places on Earth have been seriously altered, says James Watson, an ecologist at the University of Queensland, Australia.
Booming economies
The researchers had expected that nations with booming economies would also reveal expanding environmental impacts, but this wasnt always so.
Eric Sanderson, senior conservation zoologist of the Wildlife Conservation Society, who led the original 2002 Human Footprint Study, says: It is encouraging that countries with good governance structures and higher rates of urbanisation actually grew economically while slightly shrinking their environmental impacts of land use and infrastructure.
These results held even after we controlled for the effects of international trade, indicating that these countries have managed in some small measure to decouple economic growth from environmental impacts.
The study is timed to coincide with the International Union for the Conservation of Natures world congress in Hawaii next month, and the maps and data are intended as guides for researchers and policymakers who must make decisions about the protection of wildlife reserves and natural habitats.
The challenge, says Dr Venter, is to make development sustainable. Concentrate people in towns and cities so their housing and infrastructure needs are not spread across the wider landscape, he advises, and promote honest governments that are capable of managing environmental impacts.
Tim Radford, a founding editor of Climate News Network, worked for The Guardian for 32 years, for most of that time as science editor. He has been covering climate change since 1988.
Human development cannot happen in a vacuum. Therefore, maintaining the integrity of the human habitat is essential for sustainable human development. One fundamental document is The Earth Charter, approved by the Earth Charter Commission 29 June 2000 after 5 years of preparation and worldwide consultation. Another fundamental document is the annual Human Development Report of the United Nations, in which the Human Development Index (HDI) is correlated with Ecological Footprint data on a country by country basis, showing that "only a few countries come close to creating such a globally reproducible high level of human development without exerting unsustainable pressure on the planets ecological resources."
There is an emerging consensus that climate change has become the central issue of human habitat desintegration.
HUMANITY AND THE HUMAN HABITAT
HOW MANY PEOPLE CAN THE PLANET SUPPORT? CONSUMING HOW MUCH?
Making sense of the early 2000s warming slowdown, John C. Fyfe, Gerald A. Meehl, Matthew H. England, Michael E. Mann, Benjamin D. Santer, Gregory M. Flato, Ed Hawkins, Nathan P. Gillett, Shang-Ping Xie, Yu Kosaka and Neil C. Swart, Nature, 1 February 2016
UNITED NATIONS Intergovernmental Panel on Climate Change (IPCC), Fifth Assessment Report (AR5),
Summary for Policymakers (Final), 3 June 2014
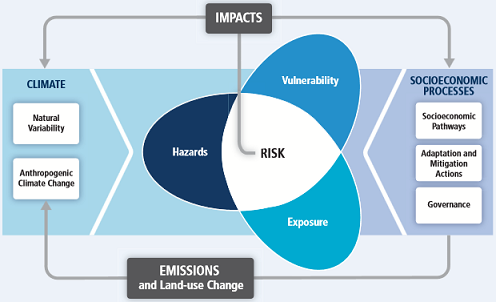
"Illustration of the core concepts of the WG2 AR5. Risks of climate-related impacts results from the interaction of climate-related hazards (including hazardous events and trends) with the vulnerability and exposure of human and natural systems. Changes in both the climate system (left) and socioeconomic processes including adaptation and mitigation (right) are drivers of hazards, exposure, and vulnerability."
This essay is organized around the following themes: The Modern Democratic Concept of Equality; Economic Inequality; The Earth Charter and the Principle of Equality; The Earth Charter and Economic Inequality; A World Founded on Visions of Equality and Sustainability.
Contrary to popular belief, there is among scientists no broad consensus about the causes of so-called climate warming/change and their effects in increasing natural disasters of all kinds.
The debate over whether the so-called global warming or climate change from the people through increased CO2 emissions, due to natural variations or factors such as sunlight, etc., or even large-scale geoengineering experiments in the past and present was caused and is not clear in the science to date and polarized the scientific community. There are here four different camps that clash here.
First: Those who make the anthropogenic CO2 emissions is solely responsible for the so-called climate change (eg IPCC)..
Second: Those who deny a change of climate completely, and thus also an anthropogenic influence.
Third: Those who see a non-anthropogenic influence on the climate, and associate it primarily factors such as the cyclical solar activity, water vapor, etc. as a trigger.
Fourth : Those who see a human influence on the climate and the environment in general, but an inter alia, the experiments and programs for climate and weather monitoring or the invention of weather and plasma weapons, the changes that occur, such as Rosalie Bertell does.
Here, Prof. Dr. Judith Curry, chair of the "School of Earth and Atmospheric Sciences" on "Georgia Institute of Technology" at a Senate hearing about how inconsistent are the facts for the results of the IPCC report, and how much room for interpretation in the scientific debate on the causes of climate change is given.
It is clear that time and again on a scientific consensus, based on the reports of the IPCC in the political context - is Intergovernmental Panel on Climate Change, referred, which does not exist in this form. In the Senate hearing under oath of "Sierra Club" President Aaron Mair by US Senator Cruz on alleged global warming is very good to see that a scientific discourse does not take place, and the proponents of the first group is very reluctant to engage in a scientific discourse. The "Sierra Club" is the oldest and largest conservation organization/lobby group in the United States which argues from the standpoint of the IPCC made.
This fact is also dedicated to the page www.climatedebatedaily.com it has set itself the task of providing a different view of the theses and arguments of the antagonism of the human contribution to climate change. Www.climatedebatedaily.com refers to scientific articles, press releases , economic studies, PR articles and blog entries and is divided into two columns. On the left side there are arguments and evidence that the vision of the supposed consensus, embodied by the IPCC - Intergovernmental Panel on Climate Change, support and assume a significant anthropogenic warming by CO2 gas. The right side is dedicated to the skeptics and presents counterarguments and alternative arguments.
It should be noted in any case that there is a view of the climatic phenomena currently occurring, nothing of the hegemonic scientific and directed by the IPCC discourse can be found, and that points to a problem which, except by Rosalie Bertell, yet was not named. This problem is fasten than the long and extensive history of military experiments and programs for weather and climate modification (see FIG. Flemming "Fixing the Sky" 2010 0) to bring under the premise, the planet and its life systems "under control" and doing a new weapon to invent, or the planet itself as such to be used (See. Bertell "war weapon planet earth" 2016 ). Additionally, concealed in the political as in the scientific debate on climate change that the researched and developed technologies are in the military and civil use for decades. Only then it is possible the use of climate engineering techniques such as the application of sulphate aerosols (sulfuric acid particles) by plane, as proponents of civil Geoengineering (eg D. Keith, L. Wood, K. Caldeira, P. Crutzen) is demanded as an urgent measure against the CO2-induced climate change and to "save the planet" to legitimize.
Rosalie Bertell comments on it in her essay "As our planet is made slowly to the wreck" as follows: "This does not mean that military experiments produce all atmospheric events and ultimately climate change. I'm just saying that it is difficult in each individual case is to distinguish the military Erdexperimente of the "real weather phenomena" of the earth! The increase of severe weather events is obvious to everyone. Tried Mother Earth, we transmit a warning? Or is it just the civilian economy, which is responsible for climate change? I think not! (Rosalie Bertell, As our planet is made slowly to the wreck, PBME Online, 2010).
There are two broad sets of strategies to ensure the long-term sustainability of the human habitat: mitigation and adaptation. As currently formulated in a globally patriarchal context, neither one assures a civilized transition from consumerism to sustainability. Such a transition becomes feasible if, and only if, there is a confluence of energy balance and gender balance. Energy balance, and a shift from fossil fuels to clean energy, is indispensable. The other indispensable catalyst is the transition from patriarchal domination to cross-gender solidarity.
Mitigation Strategies
In general, mitigation strategies attempt to minimize the risks associated with an impending threat. Ecologically, mitigation strategies attempt to reduce the rate of natural resource depletion and other negative impacts of economic activity on the human habitat. There are many kinds of mitigation strategies depending on culture, geography, the nature of the threat, vulnerability to a given threat, and the human/habitat resources to be protected from a given threat. All mitigation strategies entail a tradeoff between economic growth and the ecology of the planet:
It is now possible to estimate the influence of climate change on some types of extreme events, such as heat waves, drought, and heavy precipitation, says a new report from the National Academies of Sciences, Engineering, and Medicine. The relatively new science of extreme event attribution has advanced rapidly in the past decade owing to improvements in the understanding of climate and weather mechanisms and the analytical methods used to study specific events, but more research is required to increase its reliability, ensure that results are presented clearly, and better understand smaller scale and shorter duration weather extremes such as hurricanes and thunderstorms, said the committee that conducted the study and wrote the report.
An increasingly common question after an extreme weather event is whether climate change caused that event to occur, said committee chair David W. Titley, professor of practice in meteorology and founding director of the Center for Solutions to Weather and Climate Risk at the Pennsylvania State University. "While that question remains difficult to answer given all the factors that affect an individual weather event, we can now say more about how climate change has affected the intensity or likelihood of some events.
Extreme event attribution is a fairly new area of climate science that explores the influence of human-caused climate change on individual or classes of extreme events compared with other factors, such as natural sources of climate and weather variability. The science typically estimates how the intensity or frequency of an event has been altered by climate change and provides information that can be used to assess and manage risk, guide climate adaptation strategies, and determine greenhouse gas emissions targets. For example, in the wake of a devastating event, communities may need to make a decision about whether to rebuild or relocate and need input on how much more likely or more severe this type of event is expected to become in the future.
Some extreme event attribution studies use observational records to compare a recent event with similar events that occurred in the past, when the influence of human-caused climate change was much less. Other studies use climate and weather models to compare the meteorological conditions associated with an extreme event in simulated worlds with and without human-caused climate changes. The report finds that results are most reliable when multiple, different methods are used that incorporate both a long-term historical record of observations and models to estimate human influences on a given event.
The most dependable attribution findings are for those events related to an aspect of temperature, for which there is little doubt that human activity has caused an observed change in the long-term trend, the report notes. For example, a warmer climate increases the likelihood of extremely hot days and decreases the likelihood of extremely cold days. Long-term warming is also linked to more evaporation that can both exacerbate droughts and increase atmospheric moisture available to storms, leading to more severe heavy rainfall and snowfall events. However, temperature alone does not fully determine the probabilities of extreme events. Attributing specific extreme events to long-term climate change may be complicated by factors such as natural long-term fluctuations in the ocean surface temperatures.
Statements about event attribution are sensitive to the way the questions are framed and the context within which they are posed, the report says. For example, choices need to be made about defining the duration of the event, the geographic area impacted, what physical variables to study, what metrics to examine, and what observations or models to use. These assumptions and choices can lead to large differences in the interpretation of the results, and should be clearly stated.
The committee supported continued advancements in weather and climate modeling, and noted that focused research on weather and climate extremes would improve event attribution capabilities. In addition, community standards for attributing classes of extreme events would make it easier to compare results from multiple studies. Objective event selection and definition criteria could reduce potential selection bias and help elucidate how individual events fit into the broader picture of climate change.
Event attribution is retrospective, but the report calls for the development of predictive weather-to-climate forecasts of future extreme events that account for natural variability and human influences. This could be based on concepts and practices within the Numerical Weather Prediction framework, including routine verification of forecasts using observations and rigorous approaches to improving the forecast system.
As already mentioned in the previous section, there are two broad sets of strategies to ensure the long-term sustainability of the human habitat: mitigation and adaptation. Most probably, attaining global energy balance will require significant adaptation of human behavior in conjunction with radical economic reforms. Such behavioral adaptation and structural reforms are contingent on gender balance and integral human development. As currently formulated in a patriarchal context, neither one assures a civilized transition from consumerism to sustainability. Such a transition becomes feasible if, and only if, there is a confluence of energy balance and gender balance. Energy balance, and a shift from fossil fuels to clean energy, is indispensable. The other indispensable catalyst is the transition from patriarchal domination to cross-gender solidarity.
Adaptation Strategies
Adaptation strategies attempt to reverse environmental degradation by changing patterns of human behavior regarding production and consumption of goods and services.
The following are links to online resources on adaptation strategies:
Both mitigation and adaptation strategies have a role to play in attaining the transition to sustainability. But assuring the effectiveness of mitigation and adaptation strategies will require a radical upgrade in the quality of human relations, and this in turn will require a cultural transition from patriarchy to solidarity. This cultural transition has already started, but it may take a long time to run its course as it entails overcoming 5000+ years old bad mental habits. The transition from fossil fuels to clean energy may take a few decades but it is a matter of overcoming habits that are only 300 years old. Hopefully, increasingly pressing ecological issues and constraints will trigger human awareness and motivation to the point of enabling both transitions to unfold simultaneously and before it is too late. The following article is a good example of mitigation-adaptation tradeoffs:
Excerpt: "The world could completely phase out fossil fuels and use only renewable energy by 2050. In a joint project with the German Aerospace Centre, Greenpeace concluded that the transition would not be cheap. It would cost about $1 trillion per year to invest in the generating capacity, transmission and other infrastructure. But the fuel savings over that same time period would be $1.07 trillion a year. Further, the 2050 timeline would create jobs and be cost competitive when compared with a continued reliance on fossil fuels. Within 15 years, renewables' share of electricity generation would triple from 21% today to 64% - covering nearly two-thirds of global electricity demand, the report said. Wind power would be the largest source of electricity globally by 2050, supplying about 30% and 32% respectively. The wind industry alone could employ 8 million people by 2030, nearly 10 times more than today, almost twice as many people as currently employed by the oil and gas industry."
5. Solidarity, Subsidiarity, Sustainability, and Nonviolence
Transitioning from consumerism to sustainability will require shifting gears in many significant ways. The following principles will be instrumental in attaining the transition to clean energy.
"Solidarity is not a matter of altruism. Solidarity comes from the inability to tolerate the affront to our own integrity of passive or active collaboration in the oppression of others, and from the deep recognition of our most expansive self-interest. From the recognition that, like it or not, our liberation is bound up with that of every other being on the planet, and that politically, spiritually, in our heart of hearts we know anything else is unaffordable."
"Subsidiarity is an organizing principle that matters ought to be handled by the smallest, lowest or least centralized competent authority... A central authority should have a subsidiary function, performing only those tasks which cannot be performed effectively at a more immediate or local level... Subsidiarity is, ideally or in principle, one of the features of federalism, where it asserts the rights of the parts over the whole."
"Sustainability is the capacity to endure. In ecology, the word describes how biological systems remain diverse and productive over time. Long-lived and healthy wetlands and forests are examples of sustainable biological systems. For humans, sustainability is the potential for long-term maintenance of well being, which has environmental, economic, and social dimensions."
"Nonviolence has two (closely related) meanings. (1) It can refer, first, to a general philosophy of abstention from violence because of moral or religious principle (e.g. "She believes in nonviolence.") (2) It can refer to the behaviour of people using nonviolent action (e.g. "The demonstrators maintained their nonviolence.")
A shift is needed from consumerism and the profligate use of non-renewable energy resources to moderate use of renewable energy resources. Technologies to develop and deliver clean energy are readily available. But existing technologies, and improved ones to be developed, can make a positive contribution if, and only if, the human side of the equation (as outlined in the preceding sections) is taken care of.
SOLIDARITY, SUBSIDIARITY, AND SUSTAINABILITY IN TODAY'S WORLD
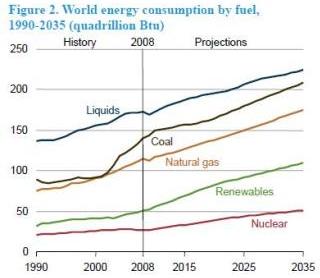
Continued use and abuse of non-renewable energy sources is unsustainable. In the long-term, renewable energy sources will be indispensable. Technologies are available (or can become available with appropriate incentives) that would make it possible to meet most human energy needs with clean energy by 2050. However, to make it happen is mainly a social issue, not a technical one. Most projections on energy supply and demand reflect a "business as usal" mindset that entails continuation of recent trends. For instance, consider the data and projections (left) from the International Energy Outlook (IEO) 2011, Energy Information Administration, US Department of Energy, September 2011. For a more comprehensive set of charts, see Energy Perspectives.
Most projections to 2050 and beyond suggest that, while energy demand will continue to grow, no significant shift from fossil fuels to renewables is to be expected. Indeed, the demand for fossil fuels is very inelastic; what other choice do people have as long as there are no clean energy alternatives?. But humans are bound to be affected by continued environmental deterioration and climate change, so the extrapolation of recent growth trends into the future does not bode well for either the future health of the planet or the wellbeing of humanity. Thus is the nature of an economic system in which short-term profits are the sole arbiter of production and consumption decisions.
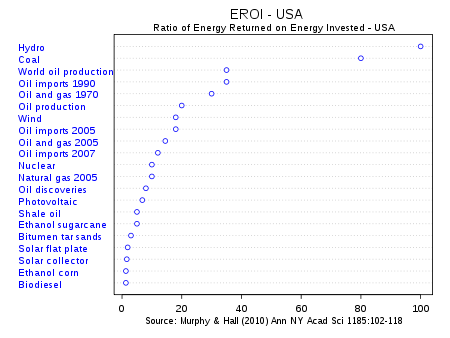
Lurking under the rosy projections of global energy production and consumption is the implicit assumption that economic growth - in terms of production and consumption of material commodities - will continue to grow even if population stabilizes. Any other assumption would be "politically incorrect" and therefore ruled out. However, the energy return on energy investment (EROEI, or EROI), and therefore the financial return on investment, is much higher for non-renewables than for renewables, as shown in the chart inserted to the right. As long as this is the case, the worldwide carbon-based economic and financial systems - driven as they are to minimize "time to market" and maximize short-term profits "one quarter at a time" - are utterly unable to shift priorities from carbon-based growth to sustainable stability. As economist Milton Friedman has pointed out, "only a crisis - actual or perceived - produces real change. When the crisis occurs, the actions that are taken depend upon the ideas that are lying around. That, I believe, is our basic function: to develop alternatives to existing policies, to keep them alive and available until the politically impossible becomes politically inevitable." A compilation of such alternatives, by no means exhaustive or definitively integrated, is presented in Section 7.
"First released in 2005, REN21s Renewables Global Status Report (GSR) provides a comprehensive and timely overview of renewable energy market, industry, investment and policy developments worldwide. It enables policymakers, industry, investors and civil society to make informed decisions. The Renewables Global Status Report relies on up-to-date renewable energy data, provided by an international network of more than 500 contributors, researchers, and authors. Check out REN21s Renewables Interactive Map for country specific data underlying the various trends highlighted in the GSR."
"A new study by BCC Research finds that the global renewable energy market (excluding biofuels) reached $432.7 billion in 2013 and $476.3 billion in 2014. This market is expected to increase to $777.6 billion in 2019, with a compound annual growth rate (CAGR) of 10.3% from 2014 to 2019. The global hydroelectric technology market for renewable energy was valued at $298 billion in 2014 and is expected to grow at a CAGR of 7.2% from 2014 to 2019 to reach a value of $422.1 billion in 2019. In terms of revenue, the wind power market was valued at nearly $104.9 billion in 2014 and is expected to reach $180.1 billion in 2019, growing at a CAGR of 11.4% from 2014 to 2019."
7. Simulation Scenarios of the Transition to Sustainability
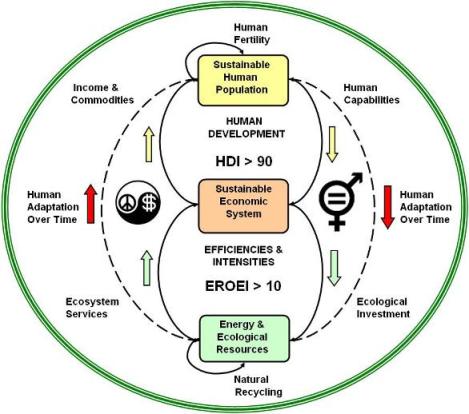
This section presents the emerging synthesis of all the information in sections 1 to 7. The synthesis is presented in the form of a concept that integrates the social, economic, and energy issues that must be resolved to attain a civilized (i.e., humane) transition during the first half of the 21st century. Energy balance for entropy control is a non-negotiable requirement, and gender balance for violence mitigation is an indispensable catalyst for the transition. The strategy is presented next from the process, time-phasing, and system perspectives:
INTEGRATED TRANSITION STRATEGY - PROCESS VIEW
The following is a conceptual diagram of the sustainable development process:
Bounded Population-Economic-Ecological System for Sustainable Human Development
Adapted from
Prosperity without Growth, Tim Jackson, 2011, Figure 12.1, Page 195
BASIC ARCHITECTURE FOR SDSIM 2.0
There are three sets of feedback loops: human development, human adaptation, and industrial mitigation. The human development loops (yellow arrows) improve gender equality and other human capabilities, and guide the allocation of income/commodities generated by the economic system. The human adaptation loops (red arrows) drive ecological investment so as to enhance the sustainability of ecosystem services. The industrial mitigation loops (green arrows) improve the productivity of energy and other resources by using "industrial engineering" methods. The working hypothesis is that mitigation loops are helpful as long as their operation is subservient to, and do not interfere with, the human development and human adaptation loops.
The convergence of gender balance, energy balance, and sustainability emerges from gender imbalance and energy imbalance jointly driving human civilization toward unsustainability. Many other factors are involved, but gender and energy imbalances are the most pervasive, and balancing them would have a neutralizing effect on all the other factors that conspire against a sustainable human society. If the transition from consumerism to sustainability is to be attained in a timely and civilized manner, i.e., before it is too late and minimizing violence as much as possible, balancing gender relations and energy flows would be the best (perhaps the only?) way to go.
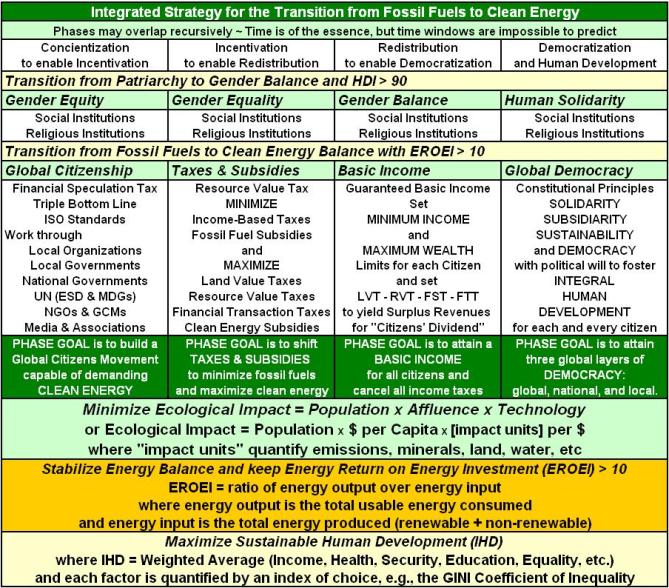
INTEGRATED TRANSITION STRATEGY - PHASES VIEW
There are four phases: concientization, incentivation, redistribution, and democratization. Phases may overlap recursively. Time is of the esence, but the specifc start/end dates for the time windows are impossible to predict.
The following acronyms, and terminology are used in this transition concept and subsequent discussion:
Energy Return on Investment (EROI)
Energy return on Energy Investment (EROEI)
Financial Transaction Tax (FTT)
Global Citizens Movement (GCM)
Human Development (HD)
Human Development Index (HDI)
Human Development Report (HDR)
Integral Human Development (IHD)
International Standards Organization (ISO)
Land Value Tax (LVT) or Resource Value Tax (RVT)
Maslow's Hierarchy of Human Needs (MASLOW)
Non-Governmental Organization (NGO)
Principle of Solidarity (SOLIDARITY)
Principle of Subsidiarity (SUBSIDIARITY)
Principle of Sustainability (SUSTAINABILITY)
Sustainable Development (SD)
Sustainable Human Development (SHD)
Triple Bottom Line (TBL)
The formula I=PxAxT, known as "Ehrlich's Equation," is generally recognized as a good model for the ecological impact of economic activity. The impact is a nonlinear function of human population (P, # of persons), affluence (A) measured as consumption per capita ($/person), and a technology factor (T) that quantifies the impact (in physical units) per dollar of consumption. Note that for impact (I) to decrease, the technology factor (T) must go down faster than the product of population (P) and lifestyle (A) grows.
Several formulations are possible for IHD. The best known is the United Nations' Human Development Index (HDI) which includes three components: life expectancy, years of schooling, and GNP per capita. The are many variations of the HDI to include, for example, the gender equality dimension. Other indices attempt to replace GNP with other measures of human wellbeing, such as the Genuine Progress Indicator (GPI), the GINI Cofficient of Inequality, and the Happy Planet Index (HPI).
The transition entails maximizing human development and wellbeing as much as possible, and minimizing ecological impacts as much as possible, in a manner that leads to economic and ecological stability. Clearly, maximizing human wellbeing and minimizing ecological impact are mutually contradictory goals as long as human wellbeing is measured in terms of material consumption per capita. Since there are resource limits, and there are limits to efficiency improvements via technological innovation, something must give: humans must adapt by shifting expectations of wellbeing from economic affluence to other human development goals. It is impossible to predict how this adaptation process will unfold, but the following synopsis of the transition phases is proposed as a point of reference:
The first phase is concientization to enable incentivation. The objective is to create widespread popular support for the required revisions of tax codes and energy subsidies. In other words, the first phase is about creating a collective mindset of global citizenship and social responsibility, strong enough to translate into political will to face the inevitable transition and implement required reforms. Gender equity is key.
The second phase is incentivation to enable redistribution. The objective is to reform tax codes and energy subsidies to expedite the transition from fossil fuels to clean energy. Applicable reforms include shifting taxes from earned income to the usage (extraction) of unearned resources and the release of pollution, as well as taxing financial transactions of dubious social value. Gender equality is key.
The third phase is redistribution to enable democratization. The objective is to institutionalize democracy with gender balance and distributive justice. This may entail adopting a Universally Guaranteed Personal Income (i.e., a basic minimum income rather than a minimum wage) and a Maximum Allowable Personal Wealth (i.e., an upper limit on financial wealth accumulation) that can be democratically adjusted periodically.
The fourth phase is worldwide democratization. The objective is democratization of global, national, and local governance with deeply ingrained gender balance and widely institutionalized implementation of the solidarity, subsidiarity, and sustainability principles. Decisions are to be made at the lowest possible level consistent with governance capabilities and the common good of humanity.
The four phases are not envisioned to be strictly sequential. They most probably will overlap, with recursions and convulsions along the way. The term "gender equality" is not to be understood as "gender uniformity." By gender equality is meant equality of dignity and personal development opportunities across the entire gender continuum. In other words, full equality in all dimensions of human life: physical, intellectual, psychological, vocational, spiritual. The term "clean energy" is to be understood as "clean renewable energy" that is naturally replenished and does not produce GHG emissions when used. It does not include absurdities such as "clean coal." The combination of gender balance and energy balance is hereby proposed as the necessary and sufficient driver for a civilized (i.e., humane) transition, and are expected to have a multiplying effect throughout the global human system.
INTEGRATED TRANSITION STRATEGY - SYSTEM VIEW
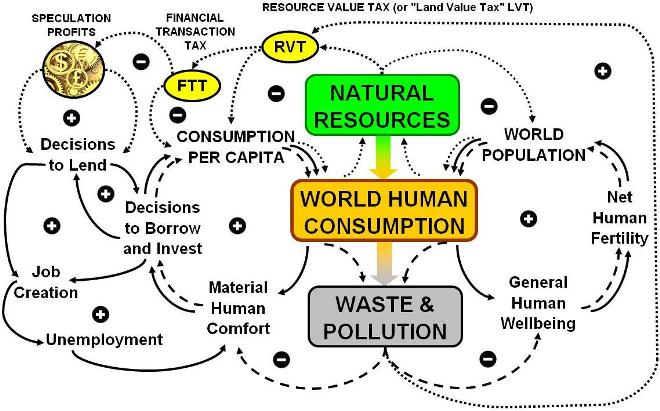
SYSTEM VIEW OF THE SUSTAINABILITY PARADOX
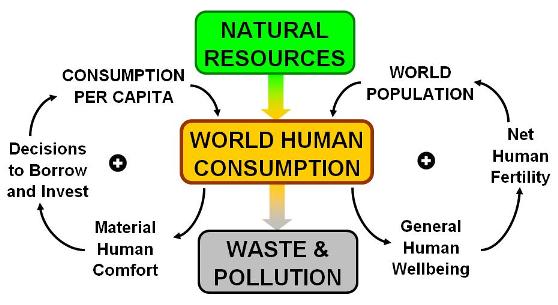
The following diagram represents the present world human system:
THE SUSTAINABILITY PARADOX
The positive signs indicate positive (self-reinforcing) feedback loops
Based on the Ecocosm Paradox Diagram by Willard R. Fey & Ann C. W. Lam, 1999
The downward flow at the center is the flow (lifecycle) for all kinds of merchandise. The feedback loop on the right-hand side is the population growth process. The feedback loop on the left-hand side is the economic growth process. If human consumption keeps increasing, natural resources are depleted and pollution accumulates. If human consumption decreases/stabilizes, the current economic/financial system destabilizes/collapses. This is the "infinite growth in a finite planet" paradox, which is more commonly referred to as the "sustainable development" paradox or simply the sustainability paradox.
The connecting arrows in the diagram indicate a ceteris paribus direction of influence. In the current world system the sense of every influence is positive, i.e., "more" leads to "more." However, the strength of the influence may change with time depending on various factors. For instance, the strength of the influence from "General Human Wellbeing" to "Net Human Fertility" may decrease after a certain threshold of wellbeing, higher levels of education, and accesibility to reproductive heath care. The strength of the influence from "Material Human Comfort" to "Decisions to Borrow and Invest" may increase when lines of credit with low interest rates are easy to obtain.
SYSTEM VIEW OF THE SUSTAINABILITY PARADOX
WITH SUPERIMPOSED TRENDS
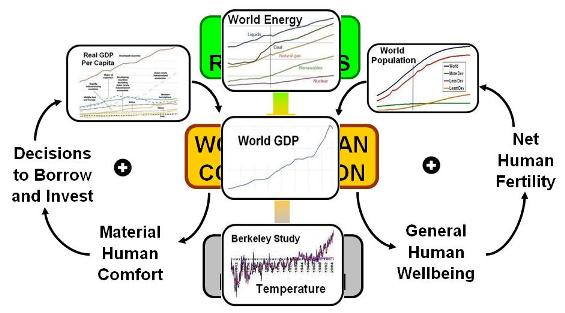
The following diagram represents the present world human system with samples of recent trend data for population, consumption, and the physical flows of energy and materials:
THE SUSTAINABILITY PARADOX WITH SUPERIMPOSED TRENDS
World Population 1950-2100 (UNDATA, 2010 Revision)
World Consumption Per Capita 1965-1995 (World Bank, 2011)
World Human Consumption 1960-2009 (World Bank, 2011)
World Energy Consumption 1990-2035(DOE EIA, IEO 2011)
World Average Land Surface Temperature 1800-2005 (Berkeley Earth, October 2011)
At the moment, the world's population is approximately 7 billion people but the rate of growth is slowing down. Global consumption of goods and services is approaching 60 trillion dollars, with 80% of commodities going to 20% of the population. Empirical data shows that consumption is growing faster than population, even though over one billion people remain in abject poverty. The global financial system is in total disarray. Worldwide, the rich-poor gap is increasing increasingly. Billions of tons of minerals and fossil fuels are being extracted from the earth each year, and billions of tons of waste and pollutants are being dumped back into the environment. Climate change, induced by global warming, is already impacting some human communities. Specific numbers are important, but recent growth patterns and their projected continuation are the main concern. It is impossible to predict the timing of forthcoming events, but it is reasonable to anticipate that infinite material growth in a finite planet is a mathematical impossibility.
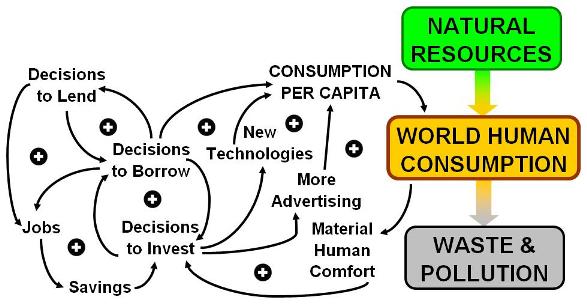
The above hypothesis on how economic growth dynamics unfold can be refined in many different ways. For instance, the following diagram includes only the economic growth loops (left portion of the diagram) to show additional investment loops on financial credit, job creation, technology development, and advertising. Now we have a multiplicity of positive feedback loops that reinforce each other and jointly reinforce human consumption, as in the following diagram:
SYSTEM VIEW OF THE SUSTAINABILITY PARADOX
WITH MULTIPLE ECONOMIC GROWTH & JOB CREATION LOOPS
The following diagram represents the present world human system with added detail on job creation in conjunction with the economic growth process:
THE SUSTAINABILITY PARADOX WITH MULTIPLE ECONOMIC GROWTH & JOB CREATION LOOPS
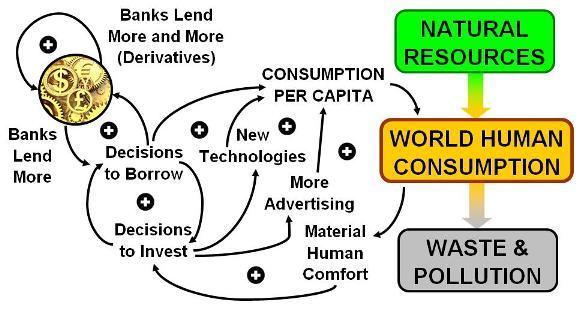
Another way to expand the hypothesis is by including the financial growth loops whereby banks lend to industry and, in addition, lend to investors seeking financial gain for the sake of financial gain (i.e., nothing is produced or consumed). Such is the case, for example, when investor A borrows money from bank X at a given interest rate, then lends the money to investor B at a higher interest rate and pockets the additional gain. This kind of financial speculation activity (which is perfectly legal and facilitated by currencies no longer being under the gold or some other tangible resource standard) that may lead to financial bubbles and crises as happened recently in the USA and more recently in Europe. Consider the following diagram:
SYSTEM VIEW OF THE SUSTAINABILITY PARADOX
WITH MULTIPLE FINANCIAL GROWTH LOOPS
The following diagram represents the present world human system with added detail on the financial dimension of the economic growth process:
THE SUSTAINABILITY PARADOX WITH MULTIPLE FINANCIAL GROWTH LOOPS
There is empirical evidence that total world population is now increasing decreasingly, so current economic conditions suggest focusing on the economic side of the sustainability paradox. The economic growth process is driven by growing consumer demand for additional material comfort in the form of goods and services. This induces decisions to invest for expansion of industrial capacity, new technologies, and more advertising. Banks reinforce investment by lending to investors, and also by lending to consumers eager to increase their per capita consumption, which is currently growing faster than population. Since the dollar and other currencies are no longer based on gold, banks also can lend for trading in derivatives and other "financial weapons of mass destruction." This unbriddled capital accumulation process, driven by short-term profits and a systematic discounting of the future, assumes that there can be infinite growth in a finite planet, and actually requires continued and unlimited growth to keep functioning. This is the essence of the sustainability paradox.
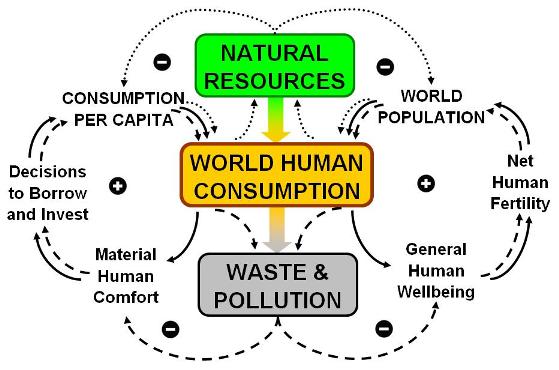
SYSTEM VIEW OF THE SUSTAINABILITY PARADIGM
The following diagram represents the future world human system:
THE SUSTAINABILITY PARADIGM
The positive signs indicate positive (self-reinforcing) feedback loops
The negative signs indicate negative (self-correcting) feedback loops
The new connectors at the top linking natural resources to population and consumption per capita create adaptation loops (dotted lines). As long as natural resources are not limiting, these loops remain inactive. When one or more natural resources (e.g., minerals, water, fossil fuels) become limiting, resource prices are bound to increase and adaptation must take place by limiting population growth, economic growth, or both. On the economic side, this entails reducing consumption, substituting one resource by another, or both.
The new connectors at the bottom linking waste/pollution accumulation to human comfort (material or otherwise) are mitigation loops (dashed lines). As long as environmental degradation does not affect human comfort, these loops remain inactive. When the accumulation of pollutants is such that human well-being (material comfort, health, etc.) is impacted, the costs of environmental remediation are bound to increase and mitigation must take place by shifting priorities from comfort to survival.
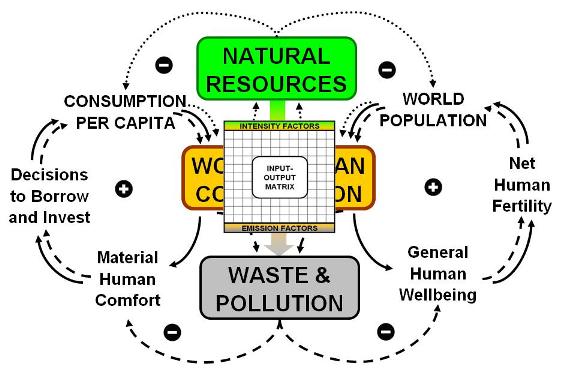
SYSTEM VIEW OF THE SUSTAINABILITY PARADIGM WITH EMBEDDED INPUT-OUTPUT MATRIX
The following diagram represents the future world human system enhanced to show the vector of resource intensities, the matrix of inter-industry transactions, and the vector of emission factors:
THE SUSTAINABILITY PARADIGM WITH EMBEDDED INPUT-OUTPUT MATRIX
The positive signs indicate positive (self-reinforcing) feedback loops
The negative signs indicate negative (self-correcting) feedback loops
Intensity factors are in resource input units per unit of merchandise produced
The input-output matrix is the Leontief matrix of interindustry transactions
Emission factors are in emission output units per unit of merchandise consumed
When the mitigation and adaptation loops are activated, analysis of possible trade-offs and substitutions will require an embedded inter-industry transactions matrix. How specificity of the analyzable trade-offs will be contingent on the granularity of industry decomposition captured by the input-output matrix. For instance, the North American Industry Classification System (NAICS) divides GDP into 24 major industry sectors which in turn are decomposed into a total of 2228 industries. The web-based Economic Input-Output Life Cycle Assessment (EIO-LCA) at the Green Design Institute, Carnegie Mellon University, divides GDP into 27 "broad sector groups," each further decomposed into a number of "detailed sectors." See also the System of National Accounts (SNA), United Nations, 2009.
SYSTEM VIEW OF THE SUSTAINABILITY PARADIGM WITH PROPOSED
RESOURCE VALUE TAXES (RVT) AND FINANCIAL TRANSACTION TAXES (FTT)
The following diagram represents the future world human system further enhanced to show self-correcting environmental and financial management loops:
THE SUSTAINABILITY PARADIGM WITH ENVIRONMENTAL & FINANCIAL LOOPS
The positive signs indicate positive (self-reinforcing) feedback loops
The negative signs indicate negative (self-correcting) feedback loops
Resource Value Taxes (RVT) are a function of natural resource depletion/deterioration
Financial Transaction Taxes are a function of RVT and the volume of non-real financial assets
RVT and FTT serve to reinforce job creation and employment opportunities
The formulation of adaptation and mitigation policies will attempt to integrate several dimensions of scientific knowledge and human experience, including gender equality issues, in order to simulate some plausible (but by no means predictive) transition scenarios and trade-offs. For a detailed list of supporting references click here. Nothing is totally unrelated to sustainable human development, and there are many variations of any conceivable transition scenario. Some of the variations to be investigated are identified in the following section.
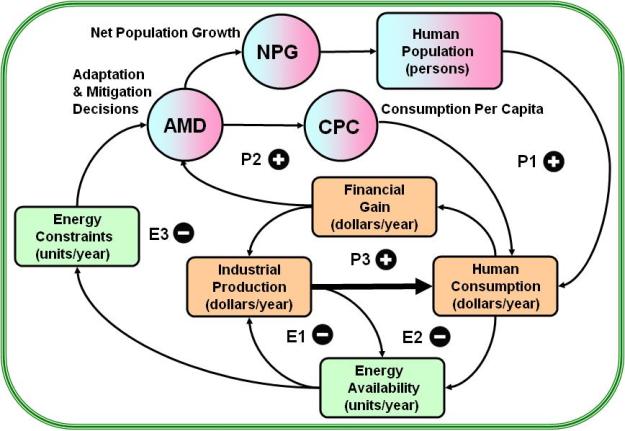
SDSIM 2.0 ARCHITECTURE
The architecture of SDSIM 2.0 integrates the sustainability paradox into the transition strategy:
SDSIM 2.0 ARCHITECTURE (WORK IN PROGRESS)
P1, P2, and P3 are the positive population-industrial-financial loops
which currently drive the sustainable development ("infinite growth") paradox
E1, E2, and E3 are negative energy production-consumption and behavioral loops, and
AMD stands for human adaptation-mitigation decisions in response to energy availability constraints
This architecture is proposed as the simplest possible model to capture both the positive (self-reinforcing) feedback loops of the growth paradox and the negative (self-regulating) feedback loops that are bound to emerge during the transition. It is anticipated that dominance will gradually (or not so gradually) shift from the P loops to the E loops as the transition unfolds. The E loops can be generalized to include natural resources other than energy, but energy is the primary concern for SDSIM 2.0. Consideration of other resources, such as water and minerals, is planned for subsequent revisions of the architecture (SDSIM 2.1, 2.2, etc.). AMD is a function of material consumption, financial gain, and energy scarcity and serves to calculate the adaptation and mitigation decisions that are forced by economic and energy constraints. The inverse of AMD is being investigated as a possible model of social cohesion, or the collective capacity to make adaptation and mitigation decisions motivated by human development incentives as opposed to biophysical constraints.
It is critical to take explicitly into account how people and governments will behave in response to changes in the mix of financial profitability and energy availability. What function could be used to model of how people will react to changes in financial profitability and energy scarcity in a given solidarity-sustainability culture? What would be the consequences for population growth (or decline), economic growth (or decline) and quality of life during the transition from consumerism to sustainability? These are the kind of questions to be investigated (via simulation experiments) with SDSIM 2.0. It is understood that social systems are more than closed-loop feedback structures no matter how highly refined the mathematical equations and parameter values. The intent of the SDSIM project is not to provide any final answers but simply to contribute, in some small way, to define more precisely the key questions that must be answered, in a broader context of practicality and wisdom, in order to attain the transition and avoid, to the extent possible, unnecessary human suffering in the process.
SOME PRELIMINARY SIMULATIONS
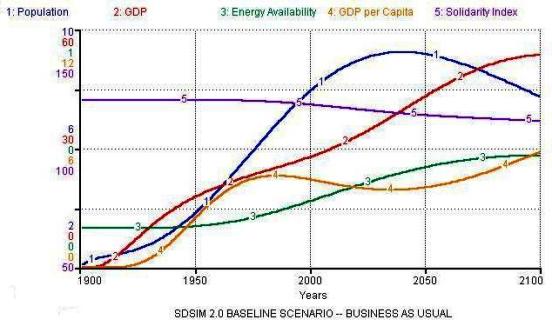
The current SDSIM 2.0 is a demo, not a capability. For instance, the graph below is a simulation of world population, gross industrial production, average consumption per capita, energy availability, and social cohesion ("solidarity index") trends, during 200 years (1900-2100):
Sustainable Development Simulation (SDSIM 2.0) from 1900 to 2100
This simulation suggests that, toward the end of the 21st century, population and social cohesion are declining while GDP and per capita consumption are still rising even as energy availability is peaking. Is this leading to a steady-state economy at high levels of production and consumption? The next graph shows the same system simulated during 1000 years (1900-2900, as shown in the horizontal axis):
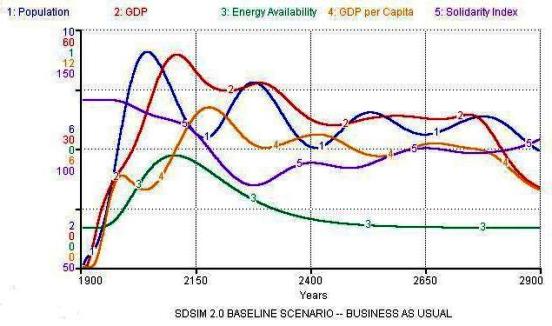
SDSIM 2.0 BASELINE SCENARIO
Sustainable Development Simulation (SDSIM 2.0) from 1900 to 2900
Due to significant time delays in adjusting population growth and resource consumption rates, and further delays in developing new technologies to "do more with less," the system goes into an extended period of oscillations in population and consumption levels. The amplitude of the oscillations seems to be gradually declining toward new steady-state levels of population and consumption, but at the expense of significant decline in social cohesion (fierce competition over increasingly scarce energy resources?). However, toward the end, drastic adjustments are induced by energy availability returning to the pre-1900 level, i.e., after a very long tail, all fossil fuel resources are finally exhausted.
Extending the simulation for another 1,000 years (next plot), the calculations suggest that another transition would be needed before long-term stability is attained:
Sustainable Development Simulation (SDSIM 2.0) from 1900 to 3900
Beyond 2100, it would seem that the system is leading to steady-state albeit via a long series of oscillations of decreasing amplitude. However, after 2800 or so, energy availability is depleted to just above the 1900 level, or basically solar influx plus of minimum amount of energy from remaining fossil sources. Then, even if massive starvation is avoided by human adaptation, the system adjusts down to a much lower steady-state in terms of population, economic throughput, and "standard of living." Time will tell whether this will make social cohesion decline even further, or eventually induce a much higher level of solidarity (human capacity for virtue out of necessity?) as suggested by the simulation. It cannot be overemphasized that this is a simulation, not a prediction. The simulation simply shows that eventually the system must go back to an energetically sustainable steady-state.
SUMMARY OF BASELINE SCENARIO
This is a simulated scenario, not a prediction. It portrays dynamic modes of behavior that can be expected during the transition from consumerism to sustainability. Both simulated time (horizontal axis) and simulated variables (vertical axis) can be adjusted without changing the fundamental patterns of growth, oscillations, and degrowth. During the transition, undoubtedly there will be noise due to short-tem social, economic, and ecological perturbations, but the overall patterns of peaks and valleys will persist in the long-term, as follows:
Population peaking, then oscillating and finally decreasing to a long-term sustainable level. Note time-phasing with GDP and per capita consumption of material goods and services.
The peak in energy availability is followed by a long decline until it settles to the steady-state flow that is allowed by solar (and perhaps other cosmic) sources of energy. The "long-tail" is the result technological developments with gradually decreasing return on energy invested.
The solidarity index is currently formulated as a nonlinear function of human population, material consumption, and energy flows. It is an indicator of social cohesion, which is tightly coupled with the sustainability of resource usage. Solidarity reinforces sustainability and vice versa.
The general patterns of peaks, oscillations, and eventual settling to steady-state are indicative of turbulence during the transition, with high risk of cultural disruptions and violence. The myth of "infinite growth in a finite planet" will not be easy to overcome.
This is not intended to be an "alarmist" scenario. However, it would be wise to take the Precautionary Principle into account when formulation sustainable development policies as we enter the Anthropocene Age.
The past cannot be changed, and the future is unknown. The exact sequence and timing of events cannot be predicted, but the general transitional patterns can be anticipated on the basis of energy biophysics. Specifically, there is empirical evidence to the effect that:
1. Fossil fuel resources are high in energy content but are not infinite.
2. Fossil fuel emissions are environmentally detrimental and/or potentially unsafe.
3. Currently known clean energy alternatives offer relatively low energy content.
Given that fossil fuels are being depleted, pollution levels are damaging the environment, and clean energy alternatives may not provide enough energy to sustain industrial economies, is it wise to just continue doing "business as usual" and trusting that some earthshaking technological breakthrough will come to pass soon enough? Is it fair for people in the "developed" nations to keep indulging in energy consumption and waste while one billion people must subsist on $2 per day or less? How will population growth rate and per capita consumption change in response to impending resource constraints? Will demographic and consumption adjustments be voluntary or involuntary? If they are involuntary, there is a high risk of violence emerging in conjunction with fierce competition for resources throughout the world. Is this "the future we want"?
Modeling and simulating the basic variables shown above is not easy but is feasible (as forty years of Limits to Growth analysis has amply demonstrated), and it is self-evident that natural resources (energetic and otherwise) currently being used are not infinite. It is also possible to quantify other physical variables such as polluting emissions, food availability, etc. The big challenge is to formulate mitigation and adaptation decision functions (the AMD node in the architecture diagram) that could reasonably mimic some plausible ways in which human behavior might change as quality of life is impacted and resource scarcities cannot be ignored any longer. Needless to say, the intent is not to be predict but "simply" to analyze, hopefully in a way that yields some useful insight. Easier said than done, as complex financial and cultural factors will come into play.
The Human Development Index, the Environmental Performance Index, the Ecological Footprint, and other such metrics, are useful in the sense that they show the social and ecological impacts of past human decisions. However, they do not take into account how human behavior might change in response to forthcoming dynamics of the transition from consumerism to sustainability. It remains to be seen whether or not such functions can be formulated in a way that is reasonable and useful to enlighten the discussion.
INTEGRATION OF SUSTAINABLE DEVELOPMENT AND CLIMATE DYNAMICS
It is becoming increasingly clear that anthropogenic climate changes may be a critical factor forcing human behavior changes during the transition from consumerism to sustainability. A comprehensive model should, therefore, integrate the human and climate systems. In terms of feedback loop structures, the following series of articles may provide a basis for such enhancement of the simulations:
8. Variations of the Integrated Transition Strategy
In terms of the transition from fossil fuels to clean energy, there seems to be a convergence of outlook that is shared by business, agencies, and NGOs. This convergence is reflected in the UN IEA and US EIA scenarios. However, in terms off replacing fossil fuels with clean energy is a post-carbon world, the Paul Chefurka's scenario is the most "pessimistic" and Stuart Staniford's scenario is the most "optimistic." Actually, it is not a matter of being optimistic or pessimistic. The divergence between "best case" and "worst case" scenarios may be due different sets of explicit
assumptions about the timing of supply peaks for non-renewables and ramping up capacities for renewables plus different sets of implicit assumptions about human behavior and policy decisions in the context of an exceedingly complex system. Energy in some form is behind everything that moves, and there are many moving parts in industrial economies.
In their recently published book, Energy and the Wealth of Nations, Hall and Klitgaard point out that discrediting economic theories that have served us well in the past serves no purpose. It is not a matter of choosing between classical economics, or neoliberal economics, or behavioral economics, or ecological economics, or biophysical economics. But, as they also point out, it is the separation of the biophysical and social dimensions of economics that renders either one useless in confronting newly emerging issues at the intersection of human behavior and physical flows. In every case, however, energy flows are the point of intersection between the behavioral and the physical dimensions, and it could well be that "economic energetics" is the key for integrating both and developing a new synthesis, as proposed long ago by (among others) economist Nicholas Georgescu-Roegen and ecologist Howard T. Odum. In this regard, the "ecological economics" synthesis of Herman Daly deserves especial mention. Hall & Klitgaard's contribution is to isolate energy flows as the focal point for analysis (and hypothesis testing) via the "Energy Return on Investment" (EROI) index.
For the current level of climate change mitigation technologies, it would seem that Staniford's scenario is too optimistic in assuming that the production of fossil fuels can be sustained and the planet can absorb the resulting accumulation of GHG emissions without potentially catastrophic climate disruptions. On the other hand, Chefurka's scenario may be too pessimistic and hopefully will not come pass as the human-impact implications would be severe. EIA's scenario seems to be the most plausible with current technologies and economic conditions. However, the emergence of radically new and economically feasible technologies cannot be ruled out, and there is always the need to plan for the worst case scenario. With this range of scenarios in mind, the following variations are being considered for modeling and analysis:
Variations in the desired "Quality of Life"
Variations in the perceived value of human solidarity
Variations in the perceived value of ecological sustainability
Variations in the combined value of human solidarity and ecological sustainability
Variations in the timing and duration of human adaptations
Variations in the human propensity to consume (volume, choices, fix vs replace
Variations in the human propensity to adapt (climate, migration, transportation)
Variations in the pace of progress in secular gender equity, equality, and balance
Variations in the pace of progress in religious gender equity, equality, and balance
Variations in the adaptability of the world financial system (speculation, regulation)
Variations in the resilience of the human habitat (pollution, climate, ecosystem services)
Variations in fossil fuel reserves and the timing of "peak oil"
Variations in the timing and intensity of climate changes
Variations in the performance, schedule, and cost of clean energy technologies
Variations in the EROI values of non-renewable and renewable energy sources
Variations in the EROI values for resource discovery
Variations in the EROI values for resource development
Variations in the EROI values for resource extraction
Variations in the EROI values for resource conversion during production
Variations in the EROI values for resource conversion during consumption
Variations in the EROI values for resource conversion during disposal
Variations in the EROI values for resource emissions during production
Variations in the EROI values for resource emissions during consumption
Variations in the EROI values for resource emissions during disposal
Given the complexity and nonlinearity of complex ecological-economic systems, computer simulation methods are more promising for the analysis of dynamic modes of behavior related to both the "sustainability paradox" and the "sustainability paradigm" systems are diagrammed above. However, input-output analysis could be very useful to calculate specific interindustry propagations of energy resource substitutions within paradox/paradigm scenarios.
EDITOR'S NOTE: These variations are to be formulated and explored with SDSIM 2.0 (to view SDSIM 1.5, click here).
What will the world look like in the year 2030? The Trend Compendium 2030 by Roland Berger supports corporate strategists and top executives as they try to answer this question. We have conducted global research, analyzed extensive data sets and interpreted the findings. We have found seven megatrends that will shape the world of tomorrow.
The global megatrends report assesses 11 global megatrends (GMT) of importance for Europes environment in the long term. In assessing key drivers, trends and implications for Europe, it aims to provide an improved basis for strategic European environmental policymaking.
Future State 2030 is the first in a series of important conversations that we want to have with government organizations over the next few years. These pages identify nine global megatrends that are most salient to the future of governments. While their individual impacts will be far-reaching, the trends are highly interrelated and thus demand a combined and coordinated set of responses.
GLOBAL MEGATRENDS:
Global megatrend #1: Demographics
Global megatrend #2: Rise of the individual
Global megatrend #3: Enabling technology
Global megatrend #4: Economic interconnectedness
Global megatrend #5: Public debt
Global megatrend #6: Economic power shift
Global megatrend #7: Climate change
Global megatrend #8: Resource stress
Global megatrend #9: Urbanization
Annual Energy Outlook 2015 EIA Releases Energy Forecast Through 2040 U.S. Energy Information Administration
Projections in the Annual Energy Outlook 2015 (AEO2015) focus on the factors expected to shape U.S. energy markets through 2040. The projections provide a basis for examination and discussion of energy market trends and serve as a starting point for analysis of potential changes in U.S. energy policies, rules, and regulations, as well as the potential role of advanced technologies.
Key results from the AEO2015 Reference and alternative cases include the following:
The future path of crude oil and natural gas prices can vary substantially, depending on assumptions about the size of global
and domestic resources, demand for petroleum products and natural gas (particularly in non-Organization for Economic
Cooperation and Development (non-OECD) countries), levels of production, and supplies of other fuels. AEO2015 considers
these factors in examining alternative price and resource availability cases.
Growth in U.S. energy productionled by crude oil and natural gasand only modest growth in demand reduces U.S. reliance on imported energy supplies. Energy imports and exports come into balance in the United States starting in 2028 in the AEO2015 Reference case and in 2019 in the High Oil Price and High Oil and Gas Resource cases. Natural gas is the dominant U.S. energy export, while liquid fuels [4] continue to be imported.
Through 2020, strong growth in domestic crude oil production from tight formations leads to a decline in net petroleum imports [5] and growth in net petroleum product exports in all AEO2015 cases. In the High Oil and Gas Resource case, increased crude production before 2020 results in increased processed condensate[6] exports. Slowing growth in domestic production after 2020 is offset by increased vehicle fuel economy standards that limit growth in domestic demand. The net import share of crude oil and petroleum products supplied falls from 33% of total supply in 2013 to 17% of total supply in 2040 in the Reference case. The United States becomes a net exporter of petroleum and other liquids after 2020 in the High Oil Price and High Oil and Gas Resource cases because of greater U.S. crude oil production.
The United States transitions from being a modest net importer of natural gas to a net exporter by 2017. U.S. export growth continues after 2017, with net exports in 2040 ranging from 3.0 trillion cubic feet (Tcf) in the Low Oil Price case to 13.1 Tcf in the High Oil and Gas Resource case.
Growth in crude oil and dry natural gas production varies significantly across oil and natural gas supply regions and cases, forcing shifts in crude oil and natural gas flows between U.S. regions, and requiring investment in or realignment of pipelines and other midstream infrastructure
U.S. energy consumption grows at a modest rate over the AEO2015 projection period, averaging 0.3%/year from 2013 through 2040 in the Reference case. A marginal decrease in transportation sector energy consumption contrasts with growth in most other sectors. Declines in energy consumption tend to result from the adoption of more energy-efficient technologies and existing policies that promote increased energy efficiency.
Growth in production of dry natural gas and natural gas plant liquids (NGPL) contributes to the expansion of several manufacturing industries (such as bulk chemicals and primary metals) and the increased use of NGPL feedstocks in place of petroleum-based naphtha [7] feedstocks.
Rising long-term natural gas prices, the high capital costs of new coal and nuclear generation capacity, state-level policies, and cost reductions for renewable generation in a market characterized by relatively slow electricity demand growth favor increased use of renewables.
Rising costs for electric power generation, transmission, and distribution, coupled with relatively slow growth of electricity demand, produce an 18% increase in the average retail price of electricity over the period from 2013 to 2040 in the AEO2015 Reference case. The AEO2015 cases do not include the proposed Clean Power Plan.[8]
Improved efficiency in the end-use sectors and a shift away from more carbon-intensive fuels help to stabilize U.S. energy-related carbon dioxide (CO2) emissions, which remain below the 2005 level through 2040.


 Solidarity reinforces Sustainability and vice versa


![[groups_small]](groups_small.gif)