Global warming of about 1°F (0.6°C) over the past several decades now loads the climate dice. Fig. 1 updates the bell curve analysis of our 2012 paper[1] for Northern Hemisphere land, which showed that extreme hot summers now occur noticeably more often than they did 50 years ago. Our new paper[2] shows that there are strong regional variations in this bell curve shift, and that the largest effects occur in nations least responsible for causing climate change.
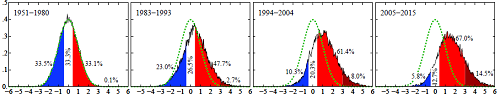
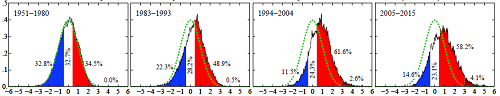
Figure 1. Frequency of occurrence of local temperature anomalies (relative to 1951-80 mean) divided by local standard deviation (horizontal axis) for Northern Hemisphere land. Upper row is for summer (Jun-Jul-Aug) and lower row is winter (Dec-Jan-Feb). Further discussion in our 2012 and 2016 papers. Click on the images to enlarge.
|
In the United States the bell curve shift is just over one standard deviation[b] in summer and less than half a standard deviation in winter (Fig. 2). Measured in units of °F (or °C) the warming is similar in summer and winter in the U.S., but the practical implication of Fig. 2 is that the public in the U.S. should notice that summers are becoming hotter but is less likely to notice the change in winter. Summers cooler than the average 1951-1980 summer still occur, but only ~19% of the time. Extreme summer heat, defined as 3 standard deviations or more warmer than 1951-1980 average, which almost never occurred 50 years ago, now occur with frequency about 7%.
Warming in Europe (see paper) is modestly larger than in the U.S. In China (Fig. 2) warming is now almost 1½ standard deviations in summer and one standard deviation in winter, a climate change that should be noticeable to people old enough to remember the climate of 50 years ago. Bell curve shifts in India (see paper) are slightly larger than in China.
In the Mediterranean and Middle East the bell curve shift in summer is almost 2½ standard deviations (Fig. 2). Every summer is now warmer than average 1951-1980 climate, and the period with summer climate is now considerably longer. Given that summers were already very hot in this region, the change affects livability and productivity as noted below. Bell curve shifts in the tropics, including central Africa (see paper) and Southeast Asia (Fig. 2), which also was already quite hot, are about two standard deviations and occur all year round.
Figure. 2. Frequency of occurrence of local temperature anomalies (relative to 1951-80 mean) divided by local standard deviation (horizontal axis) for land areas shown on map. Area under each curve is unity. Numbers above map are percent of globe covered by the selected region. Shift refers to the dashed curve fit to 2005-2015 data and are relative to the base period. Click on the image to enlarge.
|
The tropics and the Middle East in summer are in danger of becoming practically uninhabitable by the end of the century if business-as-usual fossil fuel emissions continue, because wet bulb temperature could approach the level at which the human body is unable to cool itself under even well-ventilated outdoor conditions.[3] Lesser warming still makes life more difficult and reduces productivity in these regions, because temperatures are approaching the limit of human tolerance and both agricultural and construction work are mainly outdoor activities. Middle latitude countries have a near optimum average temperature for work productivity, while warmer countries such as Indonesia, India and Nigeria are on a steep slope with rapidly declining productivity as temperature rises (see Fig. 2 of Burke et al.[4], 2015).
Warming and climate effects are not uniform within the regions that we illustrate. In the U.S., e.g., warming is largest in the Southwest, consistent with expected amplified warming in dry subtropical regions.[5] Similarly summer warming is amplified in the Mediterranean and Middle East region, where at minimum it intensifies drought conditions such as those of Syria in recent years, if not being a principal cause of the drought.[6]
Increasing temperature seems to have a significant effect on interpersonal violence and human conflict, as indicated by a body of empirical evidence in a rapidly expanding area of scientific study. In an assembly of 60 quantitative studies[7] covering all major world regions, it is found that interpersonal violence increases by 4% and intergroup conflict by 14% for each standard deviation increase of temperature. Such findings do not constitute natural laws, but they provide a useful empirical estimate of impacts of temperature change.
Figure 3. Cumulative fossil fuel CO2 emissions by national source (a) and per capita (b). Results for additional individual nations are available at Fossil Fuel CO2 Emissions. Click on the image to enlarge.
|
Human health is affected by higher temperature via impacts on heat waves, drought, fires, floods and storms, and indirectly by ecological disruptions brought on by climate change including shifting patterns of disease (see Chapter 11 of IPCC, 2014, and references therein). Vector-borne diseases, usually involving infections transmitted by blood-sucking mosquitoes or ticks, can spread to higher latitudes and greater altitudes as global warming increases.
National responsibilities for global warming can be assigned because fossil fuel CO2 is the main cause of long-term warming. Deforestation and agricultural activities contribute to airborne CO2, but restoration of soil and biosphere carbon is possible via improved agricultural and forestry practices and, indeed that is required if climate is to be stabilized. In contrast, fossil fuel carbon will not be removed from the climate system for millennia.[8] Other trace gases contribute to climate change, but CO2 causes 80% of the increase of greenhouse gas climate forcing in the past two decades[9] and much of the other 20% is related to fossil fuel mining or fossil fuel use.
Climate change is accurately proportional to cumulative CO2 emissions (Fig. 3a). The U.S. and Europe are each responsible for more than a quarter of cumulative emissions, China for about 10% and India 3%. The disparity between developed and developing country emissions is even greater with consumption-based accounting of emissions.[10] Even without consumption-based accounting, the per capita emissions of the U.S. and Europe are at least an order of magnitude greater than most developing countries.
There is thus a striking incongruity between locations of largest climate change and responsibility for fossil fuel emissions. Largest bell curve shifts are in tropical rainforest, Southeast Asia, the Sahara and Sahel, where fossil fuel emissions are very small. Climate change is also large in the Middle East, where emissions are large and rapidly growing, with several nations having higher per capita emissions than the United States (see paper).
Discussion. We conclude that continued business-as-usual fossil fuel emissions will begin to make low latitudes inhospitable. If accompanied by multi-meter sea level rise,[11] resulting forced migration and economic disruption could be devastating.
Even global warming as small as 2°C, sometimes called a safe guardrail, may have large effects. Bell curve shifts shown for 2005-2015 result from global warming of ~0.6°C relative to 1951-80. Thus 2°C warming relative to pre-industrial (1.7°C relative to 1951-1980) will result in bell curve shifts and climate impacts about three times greater than those that have occurred already. Global warming of 2°C is expected to cause sea level rise of several meters,[12] leading to inference that the potential sea level rise this century is dangerous10.
The overall message that climate science delivers to society, policymakers, and the public alike is this: we have a global emergency. Fossil fuel CO2 emissions should be reduced as rapidly as practical. We argue that country-by-country goals, the approach of the 21st Conference of the Parties[13] cannot lead to rapid phasedown of fossil fuel emissions, as long as fossil fuels are allowed to be the cheapest energy. It will be necessary to include a carbon fee that allows the external costs of fossil fuels to be incorporated in their price. Border duties on products from countries without a carbon fee, would lead to most nations adopting a carbon fee.
In view of the disparity between developed country and developing country emissions, there is a recognized obligation of assistance from developed countries. Developing countries have strong leverage to achieve that assistance, because their cooperation in improved agricultural and forestry practices is needed to store more carbon in the soil and biosphere and to limit trace gas emissions. In addition, international cooperation in generating more affordable carbon-free energies is needed, because otherwise economic development in many nations will continue to be based on fossil fuels, despite pollution and climate impacts.
References:
[a] This Communication summarizes a paper of this title (Hansen and Sato, 2016); a Video abstract is also available.
[b] The standard deviation is a measure of typical year-to-year fluctuation of seasonal-average temperature.
[1] Hansen, J., Sato, M. and Ruedy, R.: Perception of climate change, Proc. Natl. Acad. Sci. 109, 14726-14734, 2012.
[2] Hansen J. and Sato M.: Regional climate change and national responsibilities, Environ. Res. Lett. (in press).
[3] Sherwood, S.C. and Huber, M.: An adaptability limit to climate change due to heat stress, Proc. Natl. Acad. Sci. 107, 9552-9555, 2010.
[4] Burke, M, Hsiang, S.M. and Miguel, E.: Global non-linear effect of temperature on economic production, Nature 527, 235-239, 2015.
[5] Cook, K.H. and Vizy, E.K.: Detection and analysis of an amplified warming of the Sahara, J. Clim. 28, 6560-6580, 2015.
[6] Kelley, C.P., Mohtadi, S., Cane, M.A., Seager, R. and Kushnir, Y.: Climate change in the Fertile Crescent and implications of the recent Syrian drought, Proc. Natl. Acad. Sci. USA 112, 3241-3246, 2015.
[7] Hsiang, S.M., Burke, M. and Miguel, E.: Quantifying the influence of climate on human conflict, Science 341, doi:10.1126/science.1235367
[8] Archer, D.: Fate of fossil fuel CO2 in geologic time, J. Geophys. Res. 110, C09S05, 2005.
[9] Hansen, J., Kharecha, P. and Sato, M.: Climate forcing growth rates: doubling down on our Faustian bargain, Environ. Res. Lett. 8, 011006, 2013.
[10] Peters, G.P.: From production-based to consumption-based national emissions inventories, Ecolog. Econ. 65, 13-23, 2008.
[11] Hansen, J., et al.: Ice melt, sea level rise and superstorms: Evidence form paleoclimate data, climate modeling and modern observations that 2°C global warming is dangerous, arXiv:1602.01393
[12] Dutton, A., Carlson, A.E., Long, A.J., Milne, G.A., Clark, P.U., DeConto, R., Horton, B.P., Rahmstorf, S., and Raymo, M.E.: Sea-level rise due to polar ice-sheet mass loss during past warm periods, Science, 349, doi:10.1126/science.aaa4019, 2015
[13] Davenport, C.: Nations Approve Landmark Climate Accord in Paris, New York Times, 12 December, 2015.
ABOUT THE AUTHOR
Dr. James Hansen, formerly Director of the NASA Goddard Institute for Space Studies, is an Adjunct Professor at Columbia Universitys Earth Institute, where he directs the Program on Climate Science, Awareness and Solutions. He was trained in physics and astronomy in the space science program of Dr. James Van Allen at the University of Iowa. His early research on the clouds of Venus helped identify their composition as sulfuric acid. Since the late 1970s, he has focused his research on Earths climate, especially human-made climate change. Dr. Hansen is best known for his testimony on climate change to congressional committees in the 1980s that helped raise broad awareness of the global warming issue. He was elected to the National Academy of Sciences in 1995 and was designated by Time Magazine in 2006 as one of the 100 most influential people on Earth. He has received numerous awards including the Carl-Gustaf Rossby and Roger Revelle Research Medals, the Sophie Prize and the Blue Planet Prize. Dr. Hansen is recognized for speaking truth to power, for identifying ineffectual policies as greenwash, and for outlining actions that the public must take to protect the future of young people and other life on our planet.
Dr. Makiko Sato has devoted her career to researching our global climate. Before joining Climate Science, Awareness and Solutions, she spent the last few decades working closely with Dr. Hansen at NASA GISS after obtaining her PhD in physics. Her research interests include analyzing the computational results of climate modeling due to different climate forcings such as greenhouse gas increase, ozone depletion and stratospheric and tropospheric aerosol changes and analyzing global change data, especially atmospheric temperature. Dr. Sato analyzes and updates figures for critical climate diagnostics and feedback and climate forcings. All figures are available to the public on her website. Click here for Makikos website and updated figures.
|


![[groups_small]](groups_small.gif)