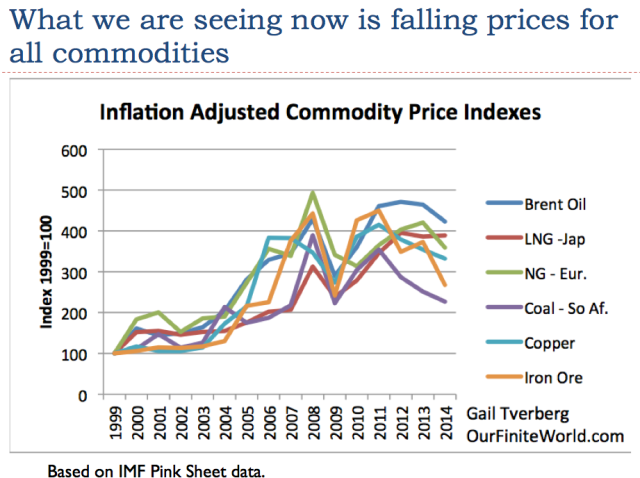
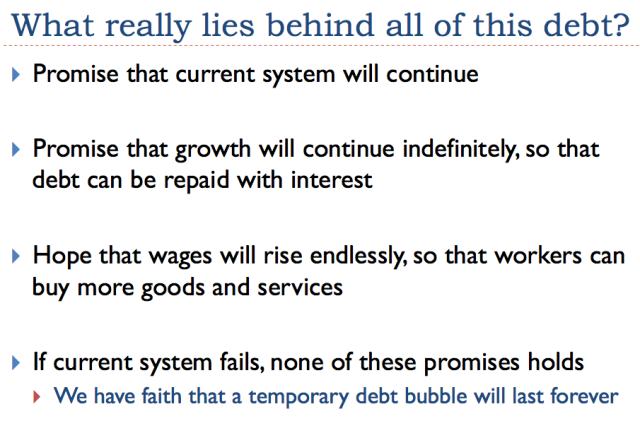
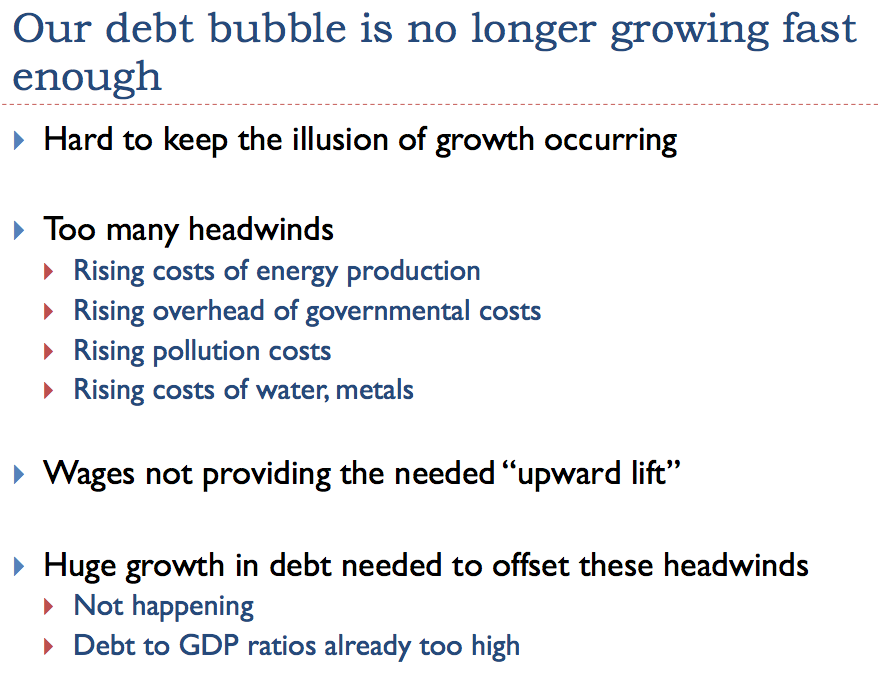
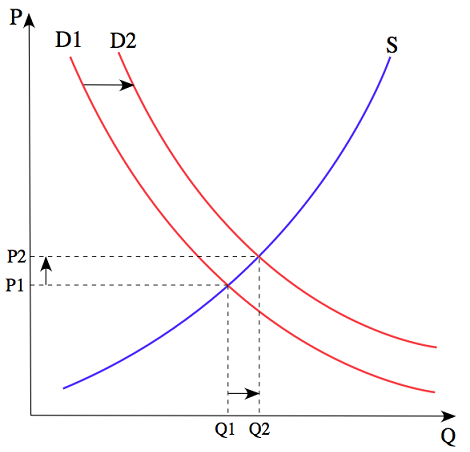
Why is the price of oil so low now? In fact, why are all commodity prices so low? I see the problem as being an affordability issue that has been hidden by a growing debt bubble. As this debt bubble has expanded, it has kept the sales prices of commodities up with the cost of extraction (Figure 1), even though wages have not been rising as fast as commodity prices since about the year 2000. Now many countries are cutting back on the rate of debt growth because debt/GDP ratios are becoming unreasonably high, and because the productivity of additional debt is falling.
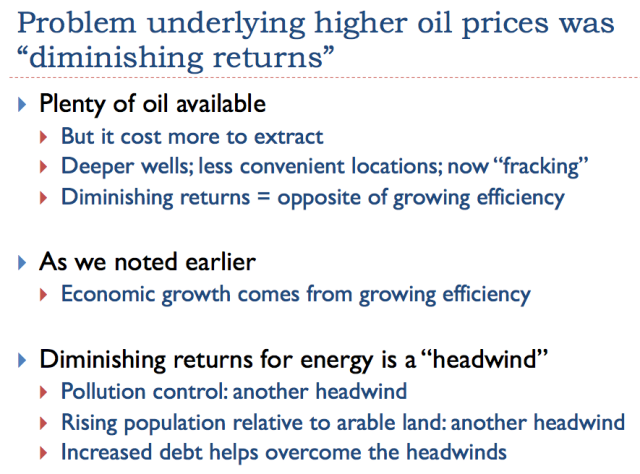
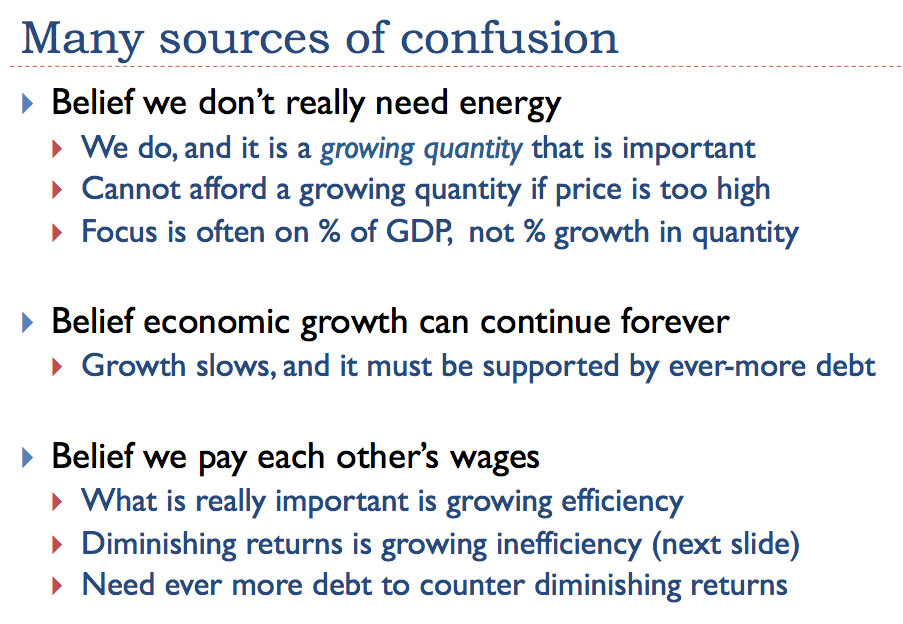
If wages are stagnating, and debt is not growing very rapidly, the price of commodities tends to fall back to what is affordable by consumers. This is the problem we are experiencing now (Slide 1).
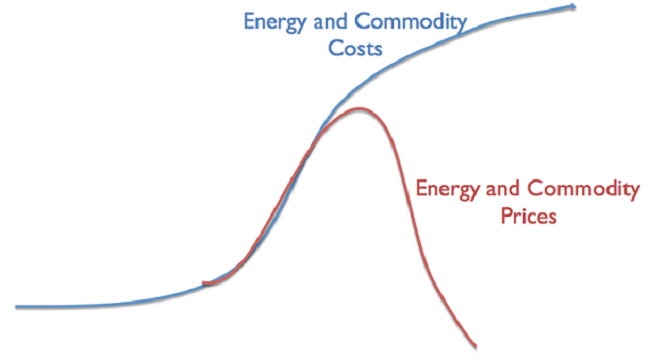
Slide 1. Author's illustration of problem we are now encountering.
I will explain the situation more fully in the form of a presentation. It can be downloaded in PDF form: Oops! The world economy depends on an energy-related debt bubble. Let’s start with the first slide, after the title slide.
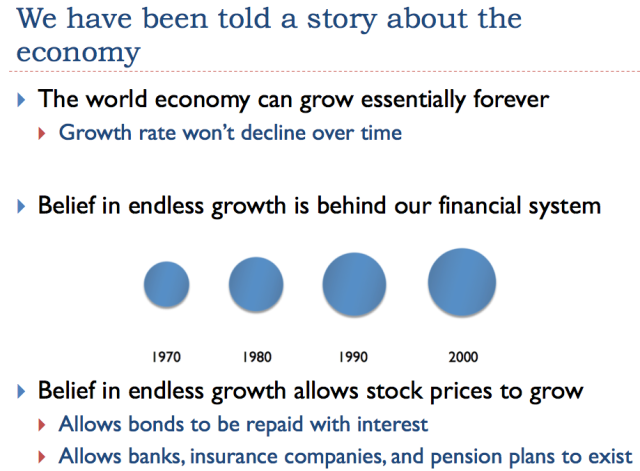
Growth is incredibly important to the economy (Slide 2). If the economy is growing, we keep needing to build more buildings, vehicles, and roads, leading to more jobs. Existing businesses find demand for their products rising. Because of this rising demand, profits of many businesses can be expected to rise over time, thanks to economies of scale.
 Slide 2
Something that is not as obvious is that a growing economy enables much greater use of debt than would otherwise be the case. When an economy is growing, as illustrated by the ever-increasing sizes of circles, it is possible to “borrow from the future.” This act of borrowing gives consumers the ability to buy more things now than they would otherwise would be able to afford–more “demand” in the language of economists. Customers can thus afford cars and homes, and businesses can afford factories. Companies issuing stock can expect that price of shares will most likely rise in the future.
Without economic growth, it would be very hard to have the financial system that we have today, with its stable banks, insurance companies, and pension plans. The pattern of economic growth makes interest and dividend payments easier to make, and reduces the likelihood of debt default. It allows financial planners to set up savings plans for retirement, and gives people confidence that the system will “be there” when it is needed. Without economic growth, debt is more of a last resort–something that might land a person in debtors’ prison if things go wrong.
 Slide 3
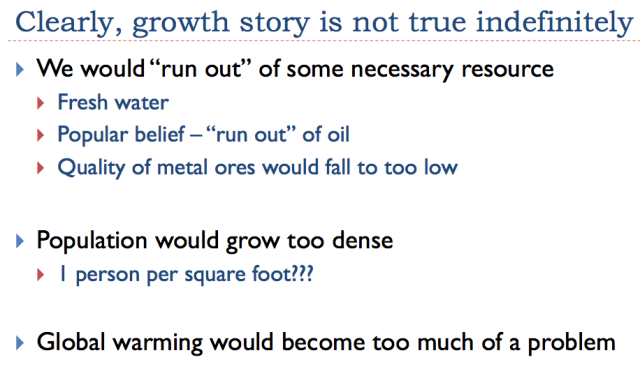
It should be obvious that the economic growth story cannot be true indefinitely. We would run short of resources, and population would grow too dense. Pollution, including CO2 pollution, would become an increasing problem.
 Slide 4
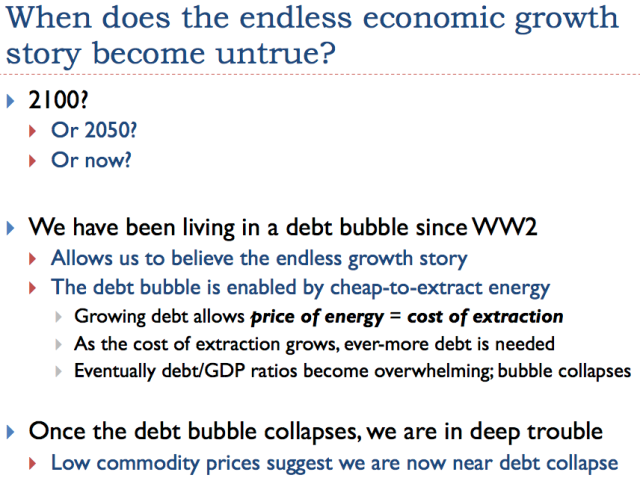
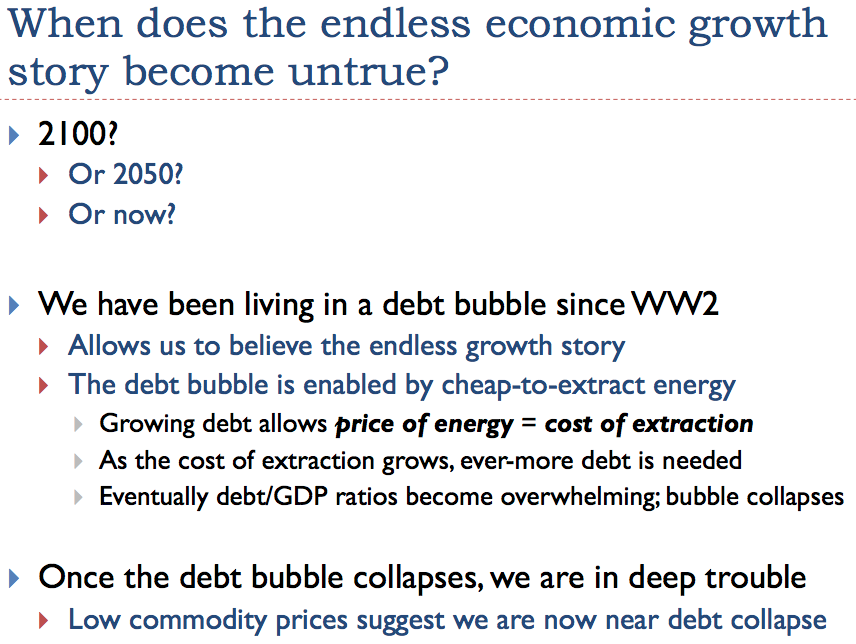
The question without an obvious answer is “When does the endless economic growth story become untrue?” If we listen to the television, the answer would seem to be somewhere in the distant future, if a slowdown in economic growth happens at all.
Most of us who read financial newspapers are aware that more debt and lower interest rates are the types of stimulus provided to the economy, to try to help it grow faster. Our current “run up” in debt seems to have started about the time of World War II. This growing debt allows “demand” for goods like houses, cars, and factories to be higher. Because of this higher demand, commodity prices can be higher than they otherwise would be.
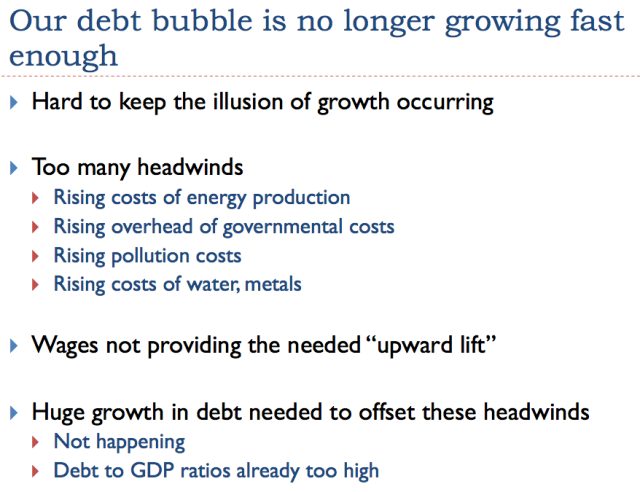
Thus, if debt is growing quickly enough, it allows the sales price of energy products and other commodities to stay as high as their cost of extraction. The problem is that debt/GDP ratios can’t rise endlessly. Once debt/GDP ratios stop rising quickly enough, commodity prices are likely to fall. In fact, the run-up in debt is a bubble, which is itself in danger of collapsing, because of too many debt defaults.
 Slide 5
The economy is made up of many parts, including businesses and consumers. The consumers have a second role as well–many of them are workers, and thus get their wages from the system. Governments have many roles, including providing financial systems, building roads, and providing laws and regulations. The economy gradually grows and changes over time, as new businesses are added, and others leave, and as laws change. Consumers make their decisions based on available products in the marketplace and they amount they have to spend. Thus, the economy is a self-organized networked system–see my post Why Standard Economic Models Dont WorkOur Economy is a Network.
One key feature of a self-organized networked system is that it tends to grow over time, as more energy becomes available. As its grows, it changes in ways that make it difficult to shrink back. For example, once cars became the predominant method of transportation, cities changed in ways that made it difficult to go back to using horses for transportation. There are now not enough horses available for this purpose, and there are no facilities for “parking” horses in cities when they are not needed. And, of course, we don’t have services in place for cleaning up the messes that horses leave.
 Slide 6
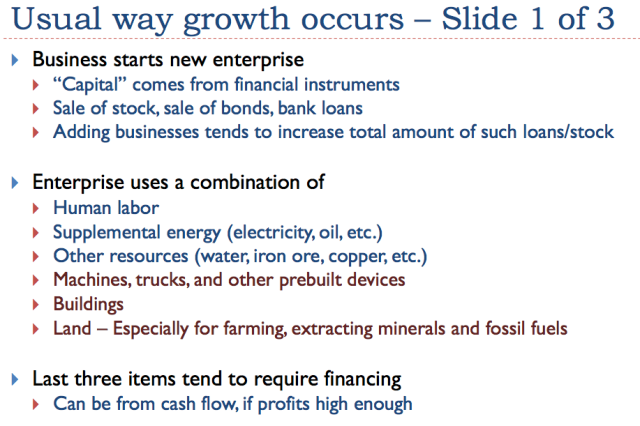
When businesses start, they need capital. Very often they sell shares of stock, and they may get loans from banks. As companies grow and expand, they typically need to buy more land, buildings and equipment. Very often loans are used for this purpose.
As the economy grows, the amount of loans outstanding and the number of shares of stock outstanding tends to grow.
 Slide 7
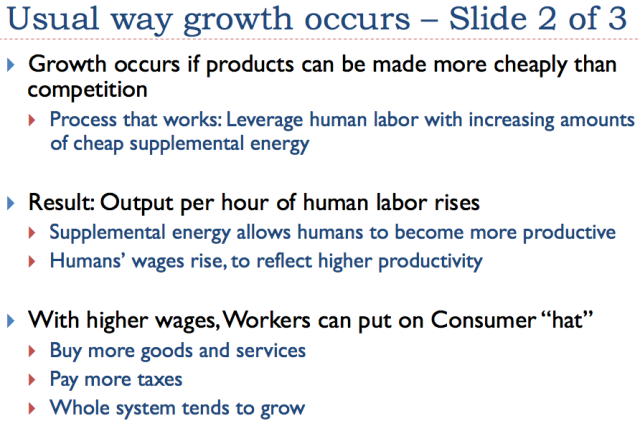
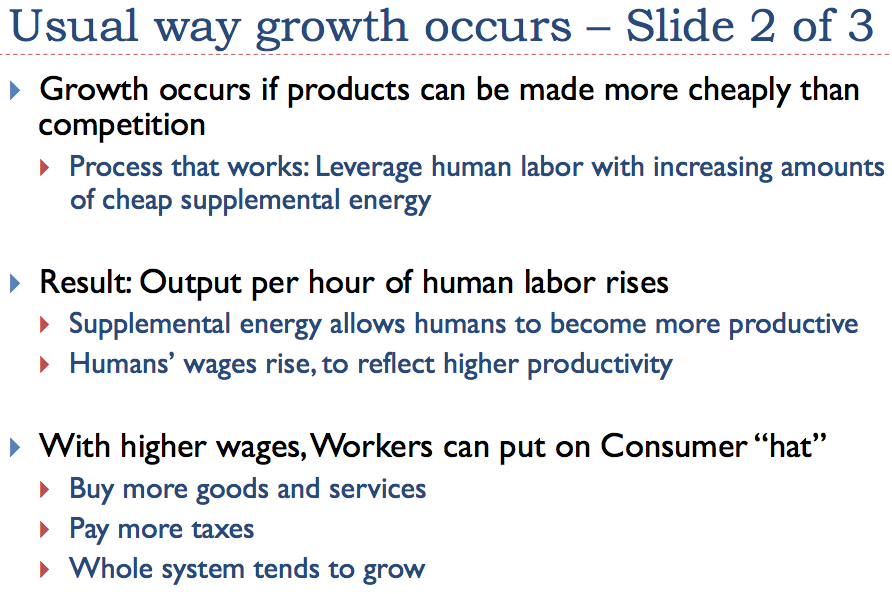
Businesses compete by trying to make goods and services more efficiently than the competition. Human labor tends to be expensive. For example, a sweater knit by hand by someone earning $10 per hour will be very expensive; a sweater knit on a machine will be much less expensive. If a company can add machines to leverage human labor, the workers using those machines become more productive. Wages rise, to reflect the greater productivity of workers, using the machines.
We often think of the technology behind the machines as being important, but technology is only part of the story. Machines reflecting the latest in technology are made using energy products (such as coal, diesel and electricity) and operated using energy products. Without the availability of affordable energy products, ideas for inventions would remain just that–simply ideas.
The other thing that is needed to make technology widely available is some form of financing–debt or equity financing. So a three-way partnership is needed for economic growth: (1) ideas for inventions, (2) inexpensive energy products and other resources to make them happen, and (3) some sort of financing (debt/equity) for the undertaking.
Workers play two roles in the economy; besides making products and services, they are also consumers. If their wages are rising fast enough, thanks to growing efficiency feeding back as higher wages, they can buy increasing amounts of goods and services. The whole system tends to grow. I think of this as the normal “growth pump” in the economy.
If the “worker” growth pump isn’t working well enough, it can be supplemented for a time by a “more debt” growth pump. This is why debt-based stimulus tends to work, at least for a while.
 Slide 8
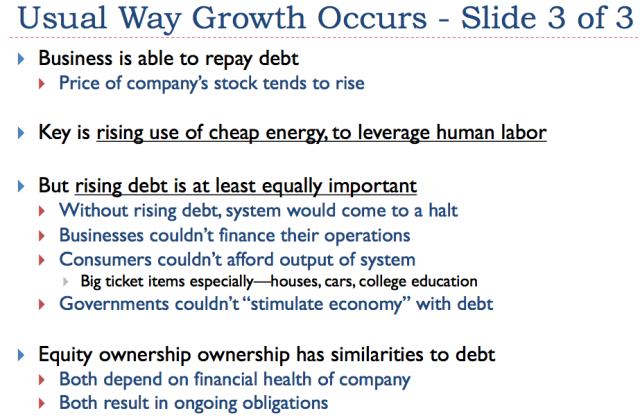
There are really two keys to economic growth–besides technology, which many people assume is primary. One key is the rising availability of cheap energy. When cheap energy is available, businesses find it affordable to add machines and equipment such as trucks to allow workers to be more productive, and thus start the economic growth cycle.
The other key is availability of debt, to finance the operation. Businesses use debt, in combination with equity financing, to add new plants and equipment. Customers find long-term debt helpful in financing big-ticket items such as homes and cars. Governments use debt for many purposes, including “stimulating the economy”–trying to get economic growth to speed up.
 Slide 9
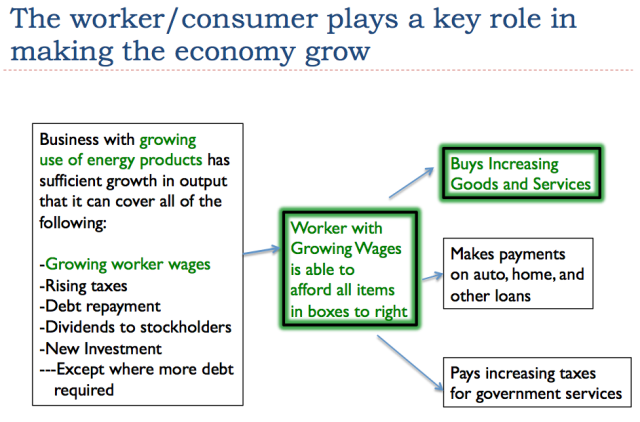
Slide 9 illustrates how workers play a key role in the economy. If businesses can create jobs with rising wages for workers, these workers can in turn use these rising wages to buy an increasing quantity of goods and services.
It is the ability of workers to afford goods like homes, cars, motorcycles, and boats that helps the economy to grow. It also helps to keep the price of commodities up, because making these goods uses commodities like iron, steel, copper, oil, and coal.
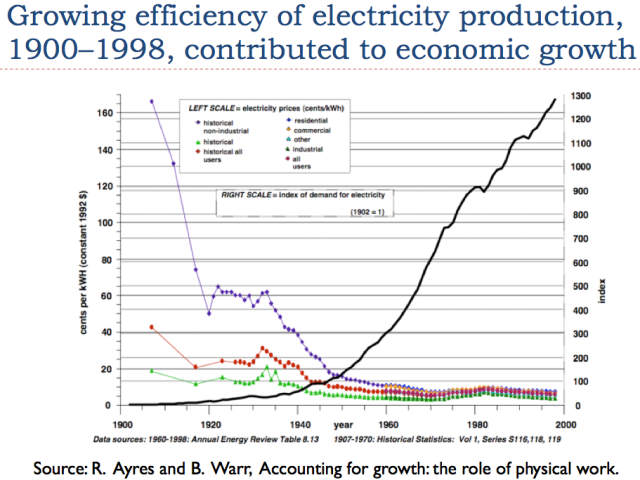 Slide 10
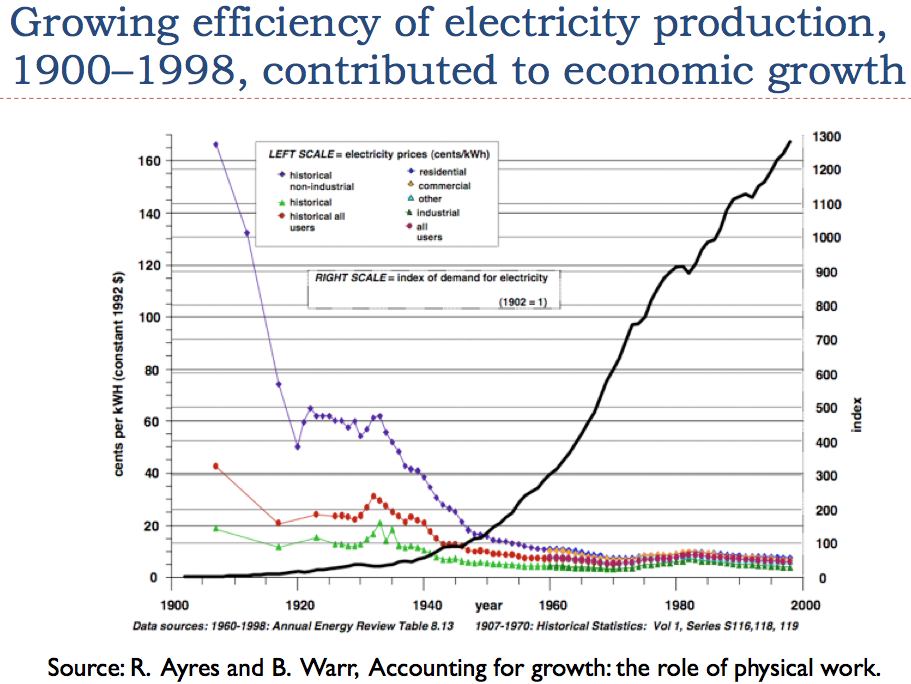
In the 1900 to 1998 period, the price of electricity production fell (shown by the falling purple, red, and green lines) as the production of electricity became more efficient. At the same time, the economy used an increasing quantity of electricity (shown by the rising black line). The reason that electricity use could grow was because electricity became more affordable. This allowed businesses to use more of it to leverage human labor. Consumers could use more electricity as well, so that they could finish tasks at home more quickly, such as washing clothes, leaving more time to work outside the home.
 Slide 11
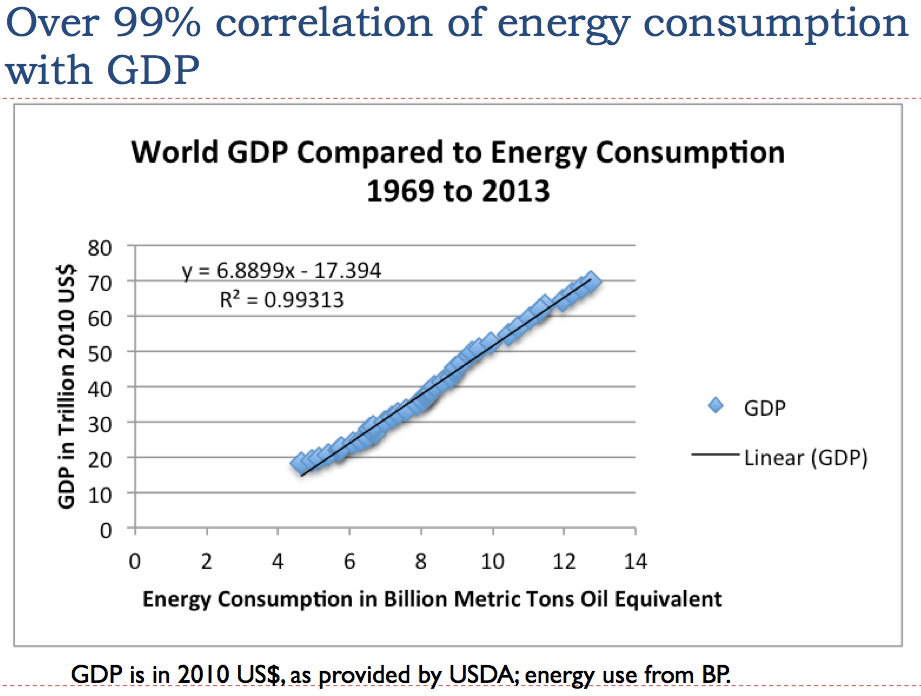
If we compare (1) the amount of energy consumed worldwide (all types added together) with (2) the world GDP in inflation-adjusted dollars, we find a very high correlation.
 Slide 12
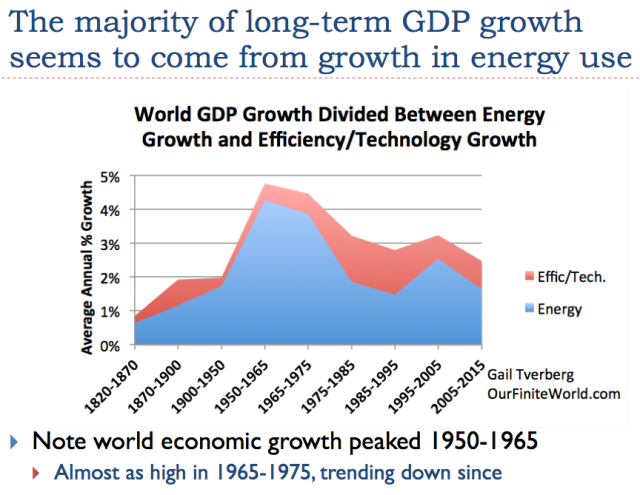
In Slide 12, GDP (represented by the top line on the chart–the sum of the red and the blue areas) was growing very slowly back in the 1820 to 1870 period, at less than 1% per year. This growth rate increased to a little under 2% a year in the 1870 to 1900 and 1900 to 1950 periods. The big spurt in growth of nearly 5% per year came in the 1950 to 1965 period. After that, the GDP growth rate has gradually slowed.
On Slide 12, the blue area represents the growth rate in energy products. We can calculate this, based on the amount of energy products used. Growth in energy usage (blue) tends to be close to the total GDP growth rate (sum of red and blue), suggesting that most economic growth comes from increased energy use. The red area, which corresponds to “efficiency/technology,” is calculated by subtraction. The period of time when the efficiency/technology portion was greatest was between 1975 and 1995. This was the period when we were making major changes in the automobile fleet to make cars more fuel efficient, and we were converting home heating to more fuel-efficient heating, not using oil.
 Slide 13
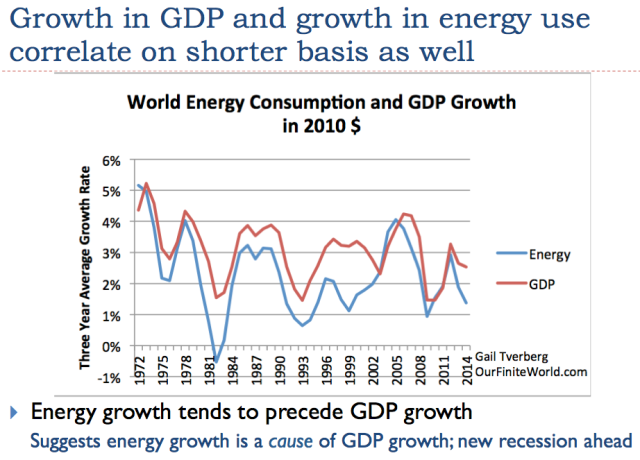
If we look at economic growth rates and the growth in energy use over shorter periods, we see a similar pattern. The growth in GDP is a little higher than the growth in energy consumption, similar to the pattern we saw on Slide 12.
If we look carefully at Slide 13, we see that changes in the growth rate for energy (blue line) tends to happen first and is followed by changes in the GDP growth rate (red line). This pattern of energy changes occurring first suggests that growth in the use of energy is a cause of economic growth. It also suggests that lack of growth in the use of energy is a reason for world recessions. Recently, the rate of growth in the world’s consumption of energy has dropped (Slide 13), suggesting that the world economy is heading into a new recession.
 Slide 14
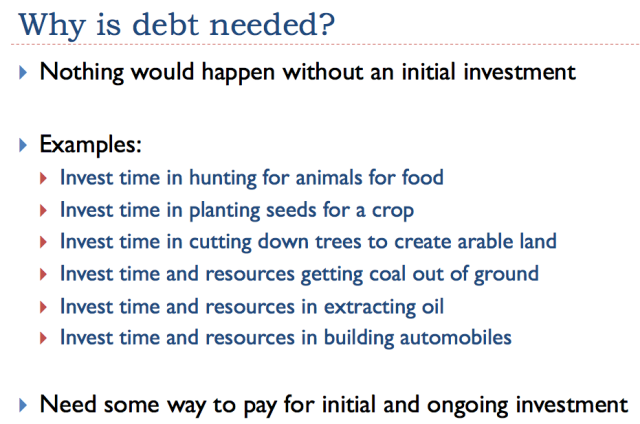
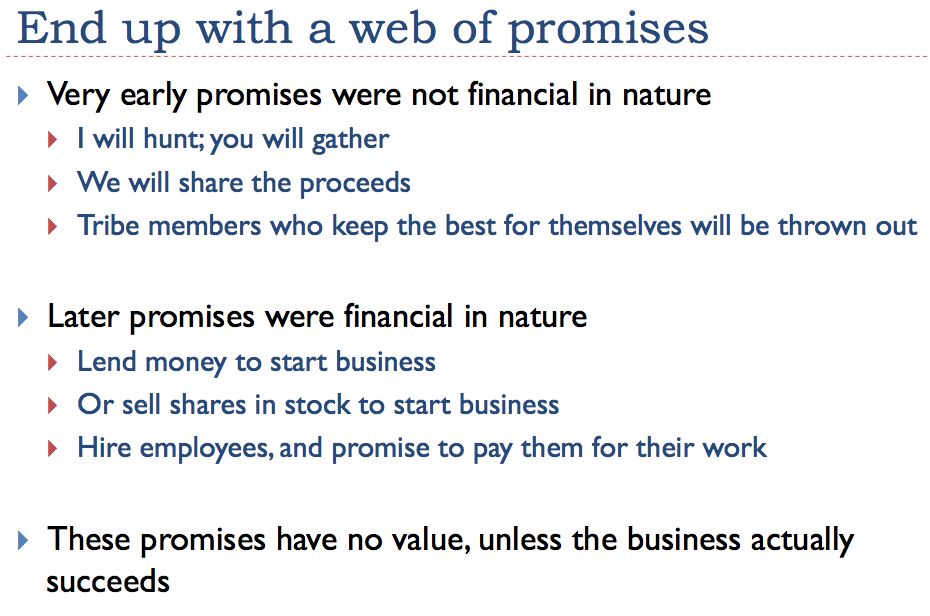
There is nearly always an investment of time and resources, in order to make something happen–anything from the growing of food to the mining of coal. Very often, it takes more than one person to undertake the initial steps; there needs to be a way to pay the other investors. Another issue is the guarantee of payment for resources gathered from a distance.
 Slide 15
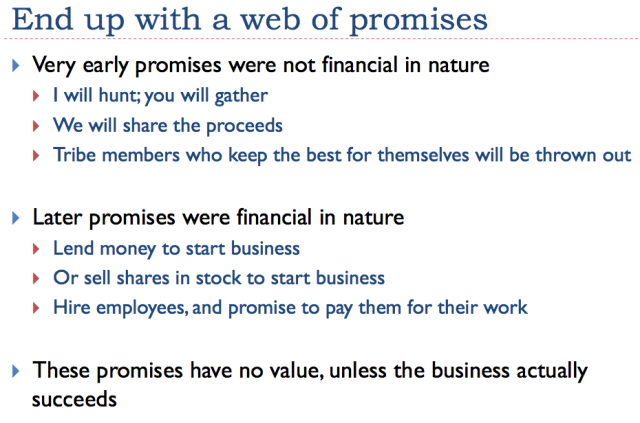
We rarely think about how all-pervasive promises are. Many customs of early tribes seem to reflect informal rules regarding the sharing of goods and services, and penalties if these rules are not followed.
Now, financial promises have to some extent replaced informal customs. The thing that we sometimes forget is that the bonds companies offer for sale, and the stock that companies issue, have no value unless the company issuing the stock or bonds is actually successful. As a result, the many promises that are made are, in a sense, contingent promises: the bond will be repaid, if the company is still in business (or if the company is dissolved, if the amount received from the sale of assets is great enough). The future value of a company’s stock also depends on the success of the company.
 Slide 16
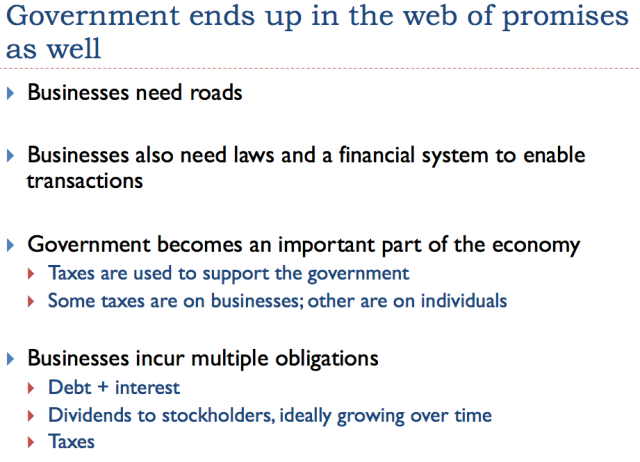
Governments become an important part of the web of promises. Governments collect their assessments through taxes. As an economy grows, the amount of government services tends to increase, and taxes tend to increase.
The roles of governments and businesses vary somewhat depending on the type of economy of a country. In a sense, this type of variation is not important. It is the functioning of the overall networked system that is important.
 Slide 17
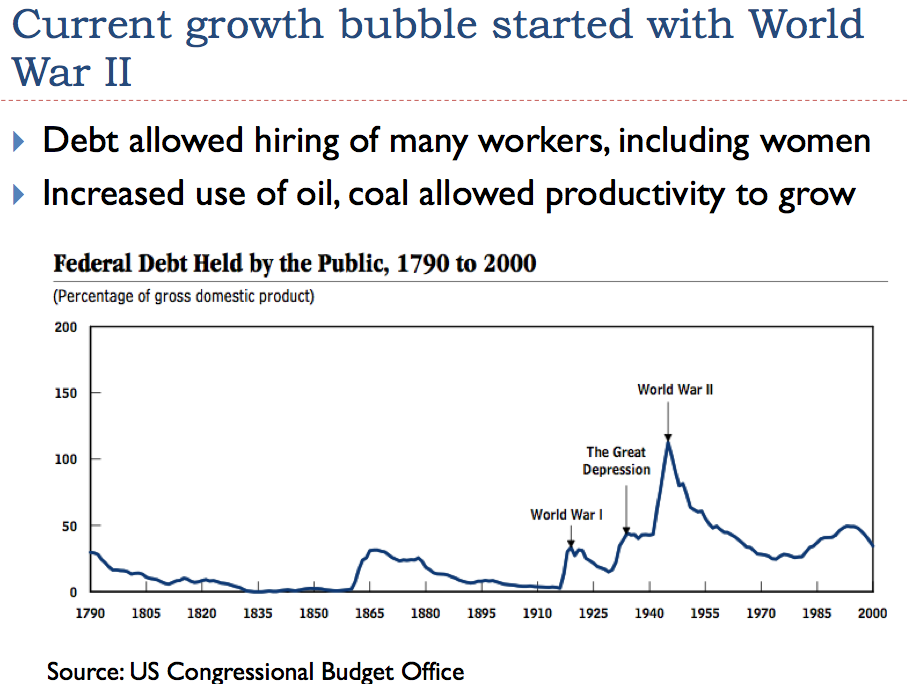
There was a very large run up in US debt about the time of World War II, not just in the US, but also in the other countries involved in World War II.
Adding the debt for World War II helped pull the US out of the lingering effects of the Depression. Many women started working outside the home for the first time. There was a ramp-up of production, aimed especially at the war effort.
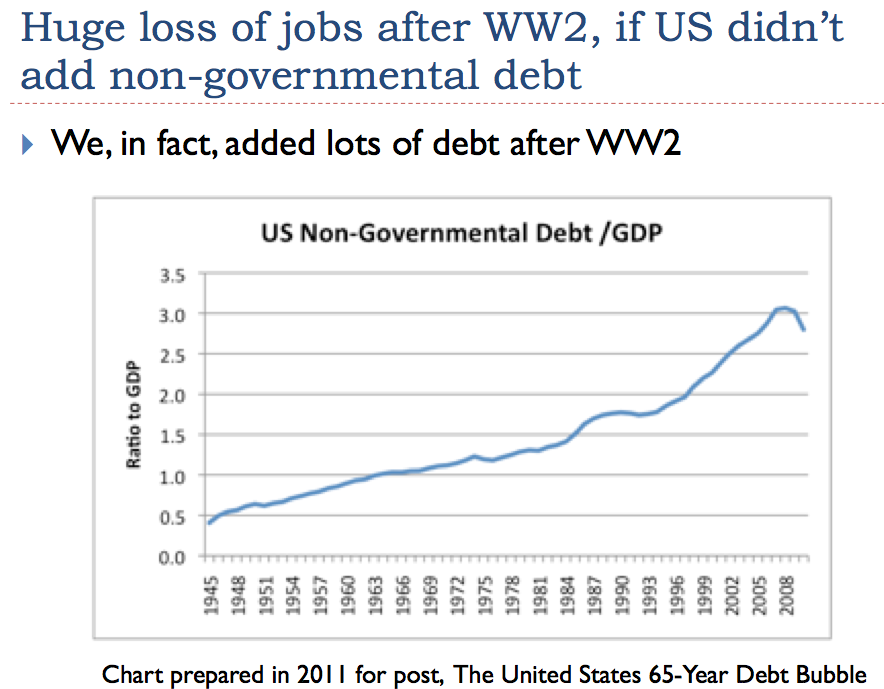
What does a country do when a war is over? Send the soldiers back home again, without jobs, and the women who had been working to support the war effort back home again, also without jobs? This was a time period when non-government debt ramped up in the US. In fact, it seems to have ramped up elsewhere around the world as well. The new debt helped support many growing industries at the time–helping rebuild Europe, and helping build homes and cars for citizens in the US. As noted previously, both energy use and GDP soared during this time period.
 Slide 19
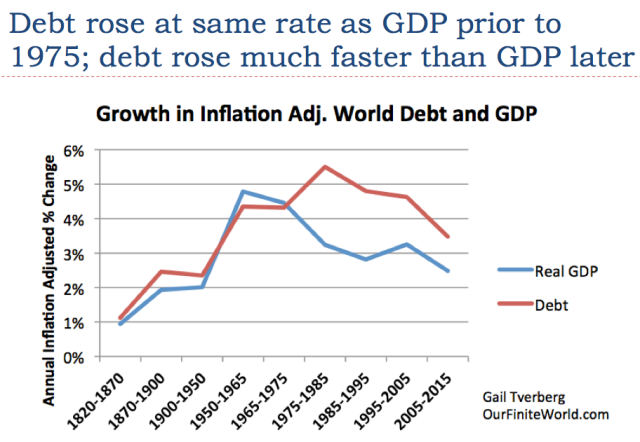
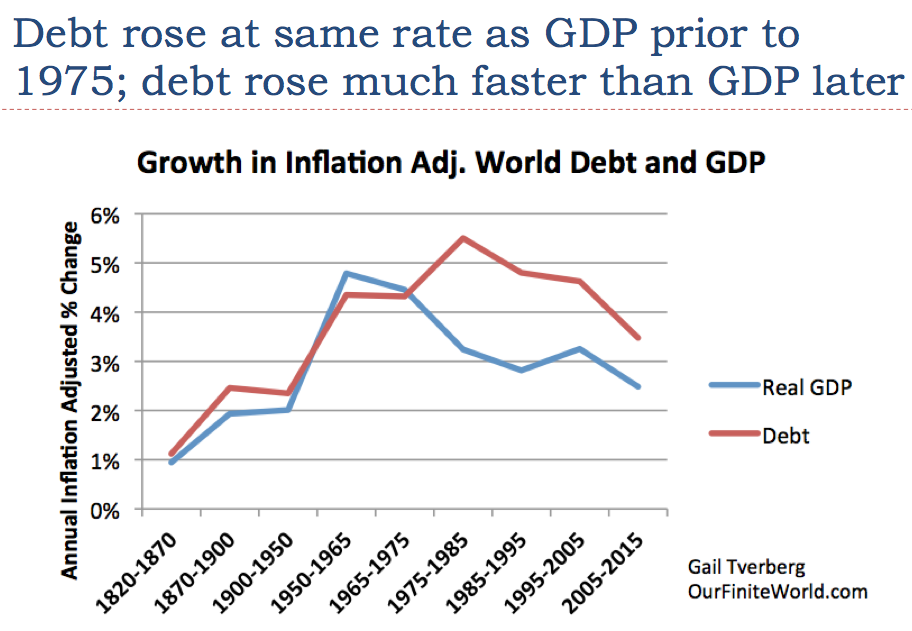
I haven’t found very good records of debt going back very far, but what I can piece together suggests that the rate of debt growth (total debt, including both government and private debt) was similar to the rate of growth of GDP, up until about 1975. Then, debt began growing much more rapidly than GDP.
 Slide 20
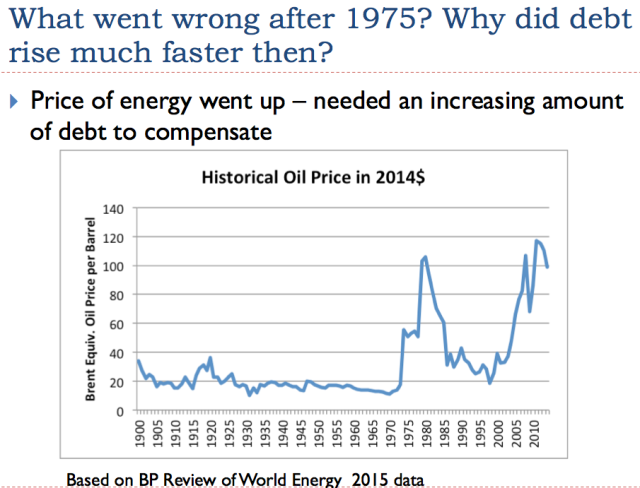
The big issue that led to a big increase in the need for debt in the early 1970s was an increase in the price of oil. Oil is the single largest source of energy. It is used in many important ways, including making food, transporting coal, and extracting metals. Thus, when the price of oil rises, so does the price of many other goods.
As we noted on Slides 11, 12, and 13, it is the growing quantity of energy consumption that is important in providing economic growth. The natural tendency with high energy prices is to cut back on energy-related consumption. Increasing debt, if it is at a sufficiently low interest rate, helps counteract this natural tendency toward less energy usage. For example, the availability of debt at a low interest makes it possible for more consumers to purchase big-ticket items like houses, cars, and motorcycles. These products indirectly lead to the growing consumption of energy products, because energy is used in making these big-ticket items and because they use energy in their continuing operation.
 Slide 21
Many people have been concerned about what they call “peak oil”–the idea that oil supply would suddenly drop because we reach geological limits. I think that this is a backward analysis regarding how the system works. There is plenty of oil available, if only the price would rise high enough and stay high for long enough.
Much of this oil is non-conventional oil–oil that cannot be extracted using the inexpensive approaches we used in the early days of oil production. In some cases, non-conventional oil is so viscous it needs to be melted with steam, before it will flow freely. Some of the unconventional oil can only be extracted by “fracking.” Some of the unconventional oil is very deep under the ocean. Near Brazil, this oil is under a layer of salt. If prices would remain high enough, for long enough, we could get this oil out.
The problem is that in order to get this unconventional oil out, costs are higher. These higher costs are sometimes described as reflecting diminishing returns–more capital goods are needed, as are more resources and human labor, to produce additional barrels of oil. The situation is equivalent to the system of oil extraction becoming less and less efficient, because we need to add more steps to the operation, raising the cost of producing finished oil products. The higher price of oil products spills over to a higher cost for producing food, because oil is used in operating farm equipment and transporting food to market. The higher cost of oil also spills over to the cost of almost anything that is shipped long distance, because oil is used as a transportation fuel.
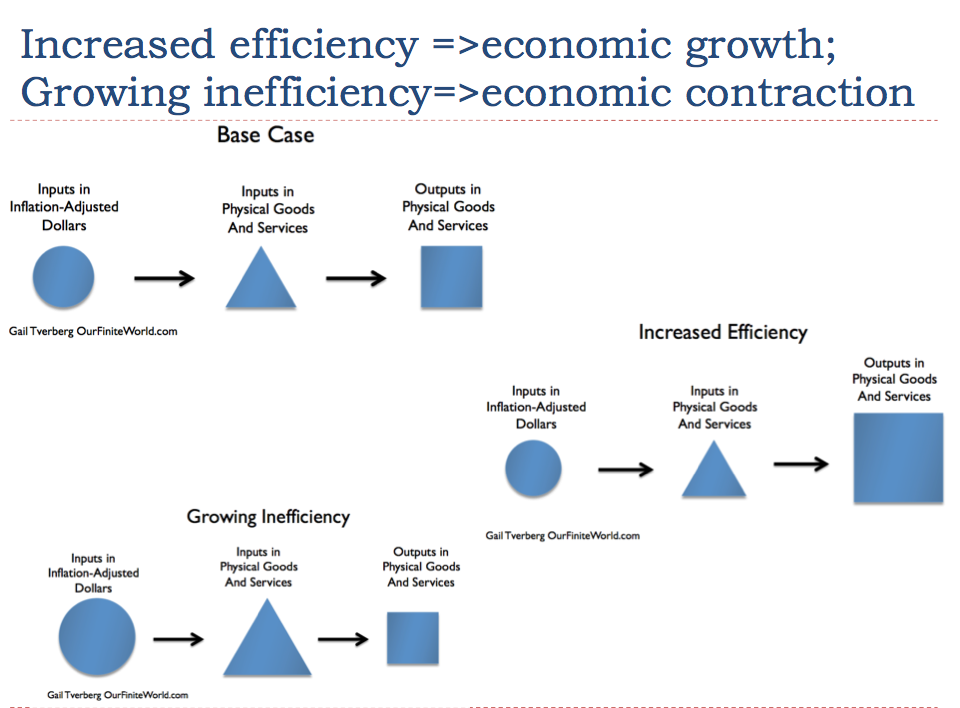
You will remember that increased efficiency is what makes an economy grow faster (Slide 7, also Slide 37). Diminishing returns is the opposite of increased efficiency, so it tends to push the economy toward contraction. We are running into many other forms of increased inefficiency. One such type of inefficiency involves adding devices to reduce pollution, for example in electricity production. Another type of inefficiency involves switching to higher-cost methods of generation, such as solar panels and offshore wind, to reduce pollution. No matter how beneficial these techniques may be from some perspectives, from the perspective of economic growth, they are a problem. They tend to make the economy grow more slowly, rather than faster.
The standard workaround for slow economic growth is more debt. If the interest rate is low enough and the length of the loan is long enough, consumers can “sort of” afford increasingly expensive cars and homes. Young people with barely adequate high school grades can “sort of” afford higher education. With cheap debt, businesses can afford to buy back company stock, making reported earnings per share rise–even though after the buy-back, the actual investment used to generate future earnings is lower. With sufficient cheap debt, shale companies can create models showing that even if their cash flow is negative at $100 per barrel oil prices ($2 out for $1 in) and even more negative at $50 per barrel ($4 out for $1 in), somehow, the companies will be profitable in the very long run.
The technique of adding more debt doesn’t fix the underlying problem of growing inefficiency, instead of growing efficiency. Instead, as more debt is added, the additional debt becomes increasingly unproductive. It mostly provides a temporary cover-up for economic growth problems, rather than fixing them.
 Slide 22
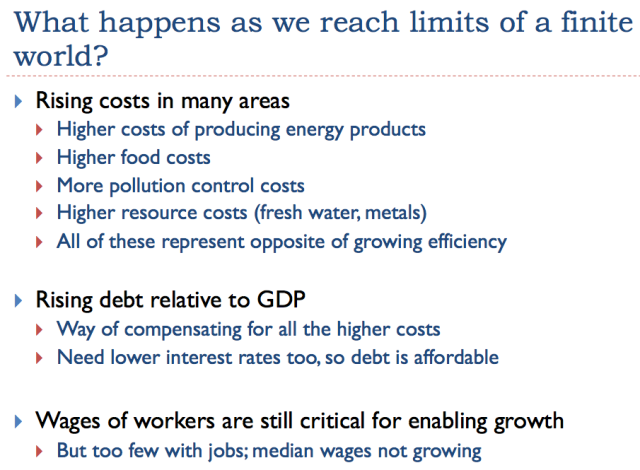
A common belief has been that as we reach limits of a finite world, oil prices and perhaps other prices will spike. In my view, this is a wrong understanding of how things work.
What we have is a combination of rising costs of production for many kinds of goods at the same time that wages are not rising very quickly. This problem can be temporarily hidden by a rising amount of debt at ever-lower interest rates, but this is not a long-term solution.
We end up with a conflict between the prices businesses need and the prices that workers can afford. For a while, this conflict can be resolved by a spike in prices, as we experienced in the 2005-2008 period. These spikes tend to lead to recession, for reasons shown on the next slide. Recession tends to lead to lower prices again.
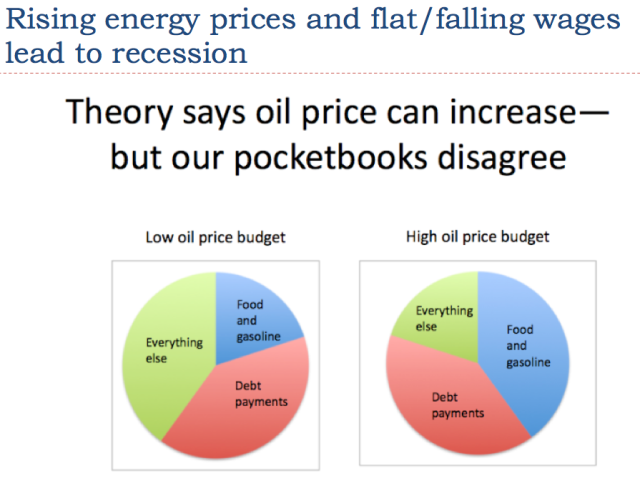 Slide 26
The image on Slide 26 shows an exaggeration to make clear the shift that takes place, if the price of oil spikes. When the price of one necessary part of consumers’ budgets increases–namely the food and gasoline segment–there is a problem. Debt payments already committed to, such as those on homes and automobiles, remain constant. Consumers find that they must cut back on discretionary spending–in other words, “Everything else,” shown in green. This tends to lead to recession.
 Slide 27
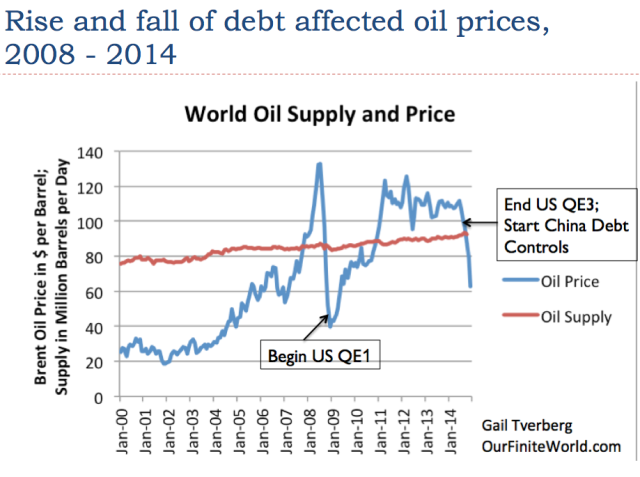
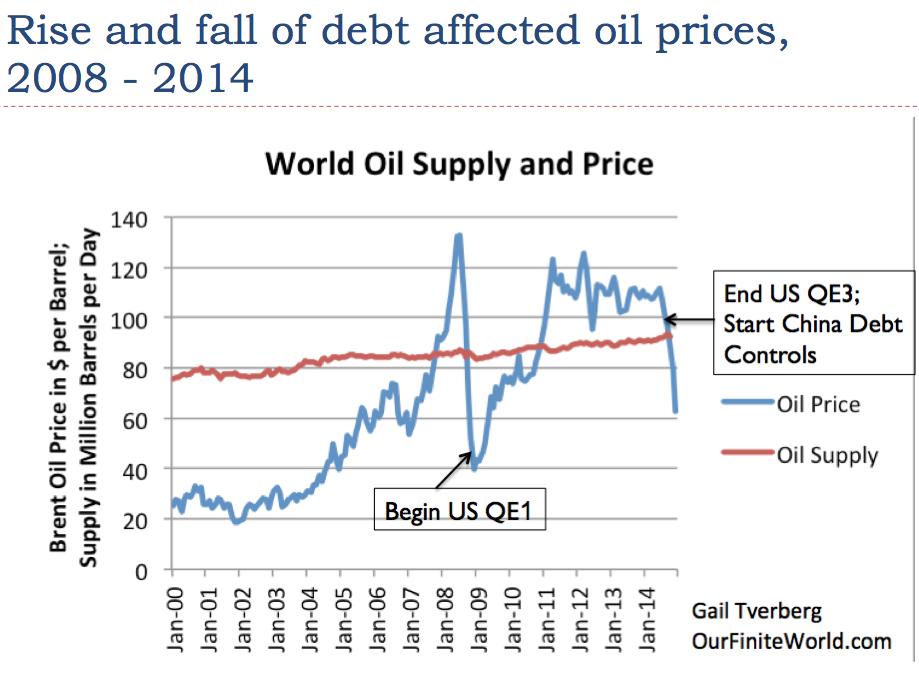
If we look at oil prices since 2000, we see that the period is marked by steep rises and falls in oil prices. In Slides 27 – 29, we will see that changes in the price of oil tend to correspond to changes in debt availability and cost.
In 2008, oil prices rose to a peak in July, and then dropped precipitously to under $40 per barrel in December of the same year. Slide 27 shows that the United States began its program of Quantitative Easing (QE) in late 2008. This helped to lower interest rates, especially longer-term interest rates. China and a number of other countries also raised their debt levels during this period. We would expect greater debt and lower interest rates to increase demand for commodities, and thus raise their prices, and in fact, this is what happened between December 2008 and 2011.
The drop in prices in 2014 corresponds to the time that the US phased out its program of QE, and China cut back on debt availability. Here, the economy is encountering less cheap debt availability, and the impact is in the direction expected–a drop in prices.
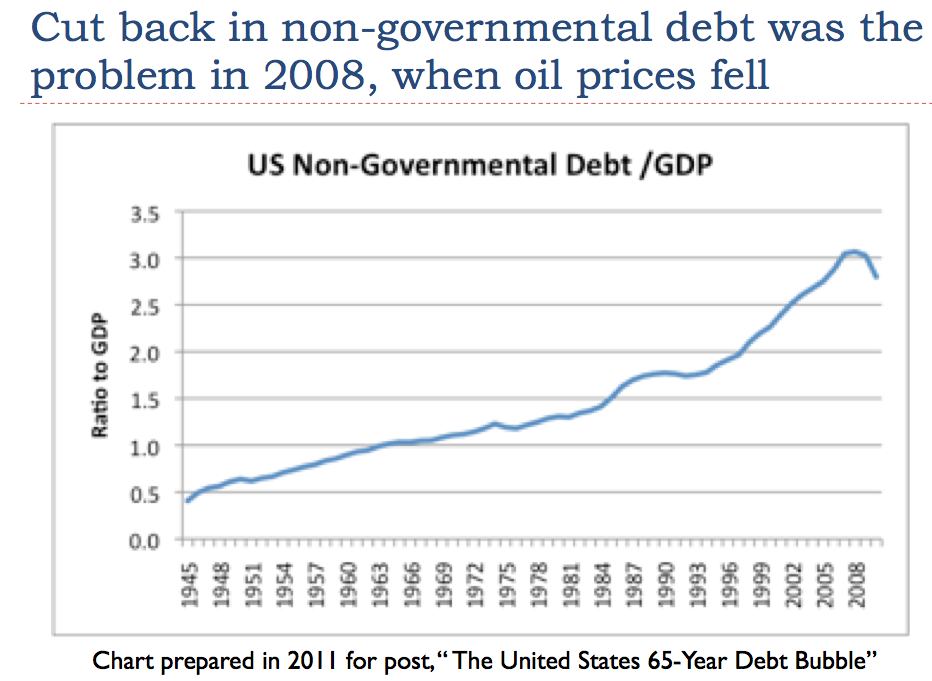
If we go back to the steep drop in oil prices in July 2008, we find that the timing of the drop in prices matches the timing when US non-governmental debt started falling. In my academic article, Oil Supply Limits and the Continuing Financial Crisis, I show that this drop in debt outstanding takes place for both mortgages and credit card debt.
 Slide 29
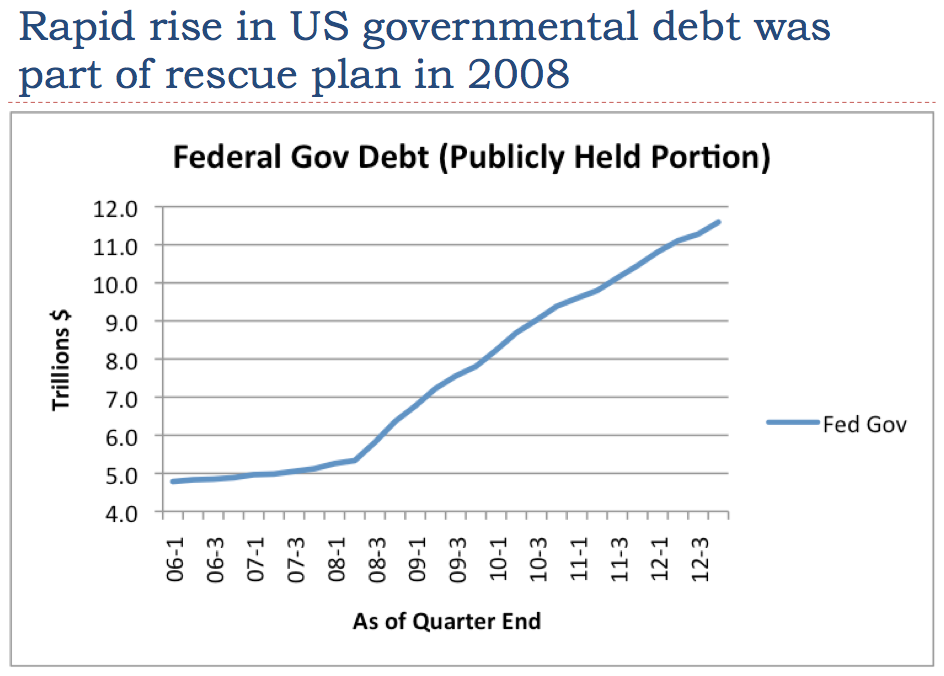
The US government, as well as other governments around the world, responded by sharply increasing their debt levels. This increase in governmental debt (known as sovereign debt) is part of what helped oil and other commodity prices to rise again after 2008.
 Slide 30
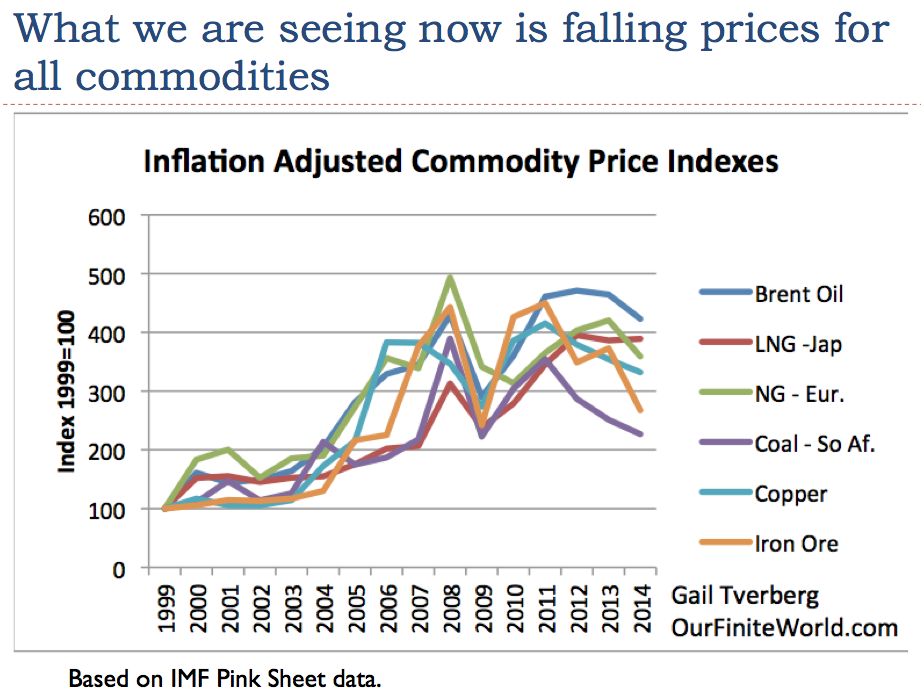
We often hear about the drop in oil prices, but the drop in prices is far more widespread. Nearly all commodities have dropped in price since 2011. Today’s commodity price levels are below the cost of production for many producers, for all of these types of commodities. In fact, for oil, there is hardly any country that can produce at today’s price level, even Saudi Arabia and Iraq, when needed tax levels by governments are considered as well.
Producers don’t go out of business immediately. Instead, they tend to “hold on” as best they can, deferring new investment and trying to generate as much cash flow as possible. Because most of them have no alternative way of making a living, they often continue producing, as best they can, even with low prices, deferring the day of bankruptcy as long as possible. Thus, the glut of supply doesn’t go away quickly. Instead, low prices tend to get worse, and low prices tend to persist for a very long period.
 Slide 31
In 2008, we had an illustration of what can go wrong when the economy runs into too many headwinds. In that situation, the price of oil and other commodities dropped dramatically.
Now we have a somewhat different set of headwinds, but the impact is the same–the price of commodities has dropped dramatically. Wages are not rising much, so they are not providing the necessary uplift to the economy. Without wage growth, the only other approach to growing the economy is debt, but this reaches limits as well. See my post, Why We Have an Oversupply of Almost Everything (Oil, labor, capital, etc.)
There is some evidence that the Great Depression in the 1930s involved the collapse of a debt bubble. It seems to me that it may very well have also involved wages that were falling in inflation-adjusted terms for a significant number of wage-earners. I say this, because farmers were moving to the city in the early 1900s, as mechanization led to lower prices for food and less need for farmers. I haven’t seen figures on incomes of farmers, but I wouldn’t be surprised if they were dropping as well, especially for the many farmers who couldn’t afford mechanization. Wages for those who wanted to work as laborers on farms were likely also dropping, since they now needed to compete with mechanization.
In many ways, the situation that led up to the Great Depression appears to be not too different from our situation today. In the early 1900s, many farmers were being displaced by changes to agriculture. Now, wages for many are depressed, as workers in developed economies increasingly compete with workers in historically low-wage countries. Additional mechanization of manufacturing also plays a role in reducing job opportunities.
If my conjecture is right, the Great Depression may have been caused by problems similar to what we are seeing today–wages that were too low for a large segment of the economy, thus reducing economic growth, and a temporary debt bubble that tended to cover up the wage problem. Once the debt bubble collapsed, demand for commodities of all types collapsed, and prices collapsed. This problem was very difficult to fix.
 Slide 32
When we add more debt to the economy, users of debt-financing find that more of their future income goes toward repaying that debt, cutting off the ability to buy other goods. For example, a young person with a large balance of student loans is unlikely to be able to afford buying a house as well.
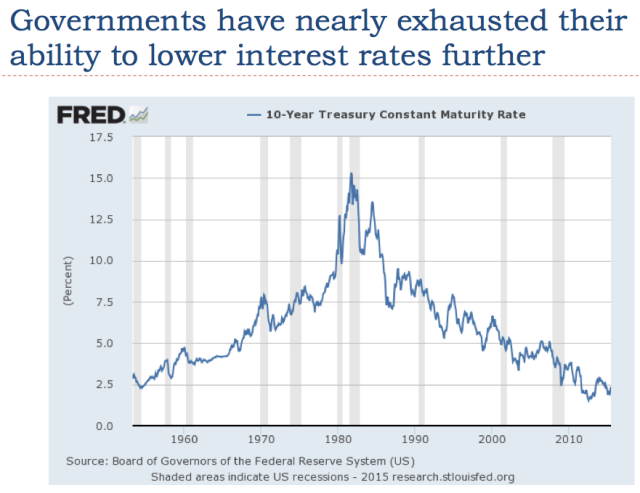
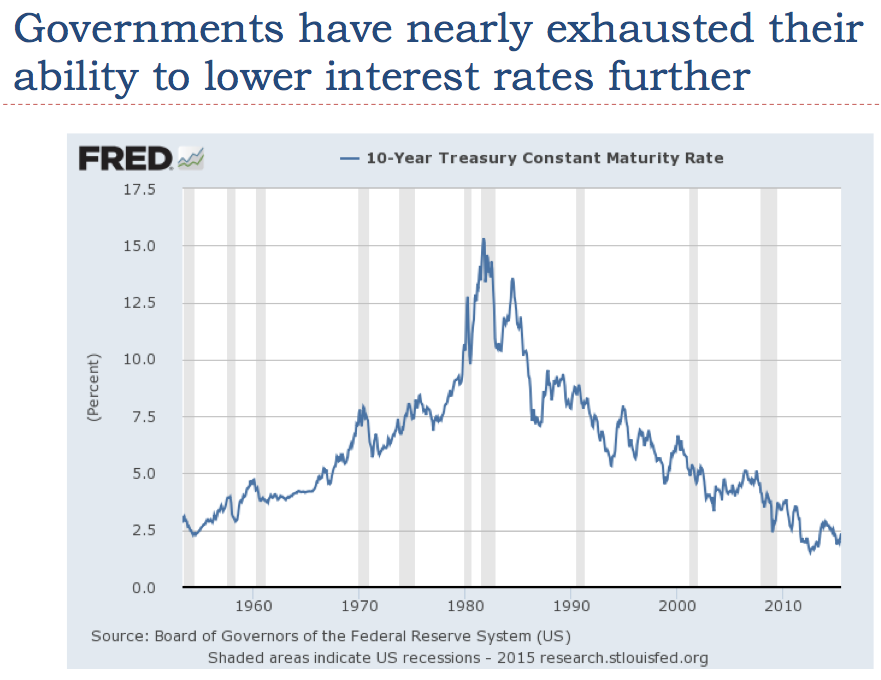
A way of somewhat mitigating the problem of too much income going toward debt repayment is lowering interest rates. In fact, in quite a few countries, the interest rates governments pay on debt are now negative.
 Slide 33
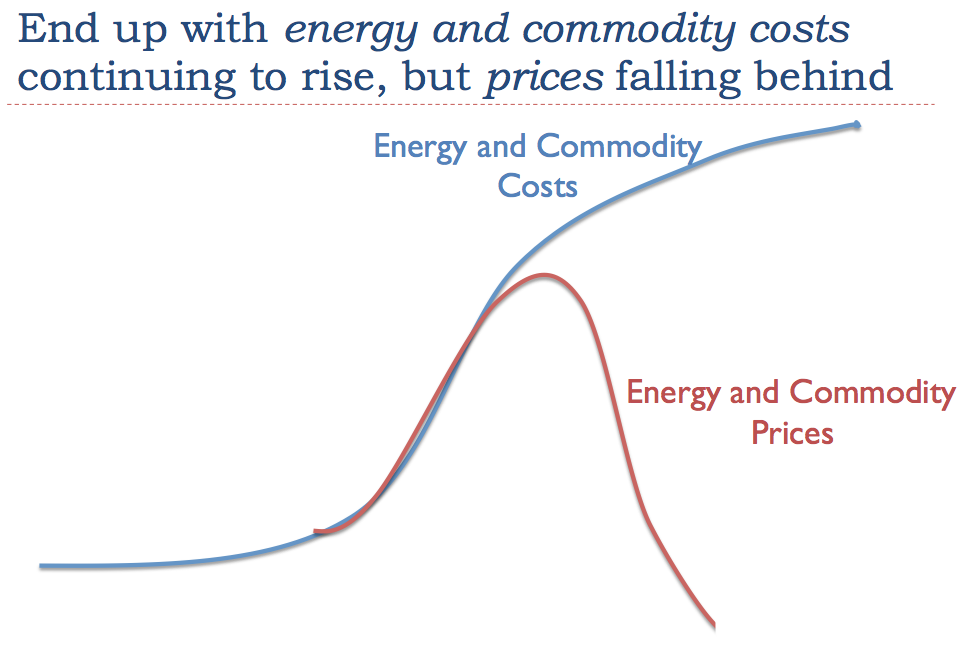
If the cost of producing commodities continues to rise, but the price that consumers can afford to pay does not rise sufficiently, at some point there is a problem. Instead of continuing to rise, prices start to fall below their cost of production. This drop can be very sharp, as it was in 2008.
The falling price of commodities is the same situation we encountered in 2008 (Slide 27); it is the same situation we reached at the beginning of the Great Depression back in 1929. It seems to happen when wage growth is inadequate, and the debt level is not growing fast enough to hide the inadequate wage growth. This time around, we are also challenged by the cost of producing commodities rising, something that was not a problem at the time of the Great Depression.
 Slide 34
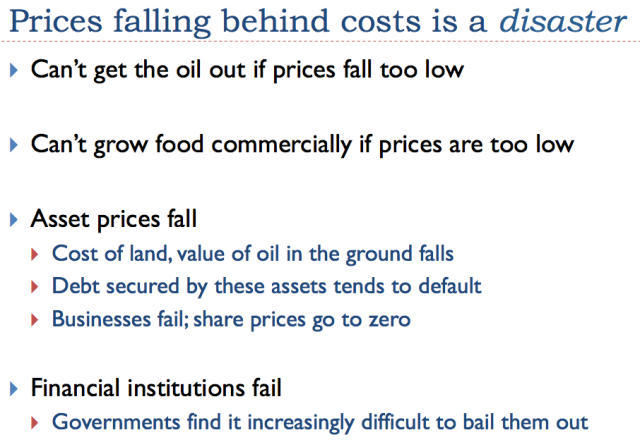
If we think about the situation, having prices fall behind the cost of production is a disaster. We can’t get oil out of the ground, if prices are too low. Farmers can’t afford to grow food commercially, if prices remain too low.
Prices of assets such as the value of farmland, the value of oil held by leases, and the value of metal ores in mines will fall. Assets such as these secure many loans. If an oil company has a loan secured by the value of oil held by lease, and this value falls permanently, there is a significant chance that the oil company will default on the loan.
The usual belief is, “The cure for low prices is low prices.” In other words, the situation will fix itself. What really happens, though, is that everyone is so afraid of a big crash that all parties make extreme efforts to avoid a crash. In fact, there is evidence today that banks are “looking the other way,” rather than taking steps to cut off lending to shale drillers, when current operations are clearly unprofitable.
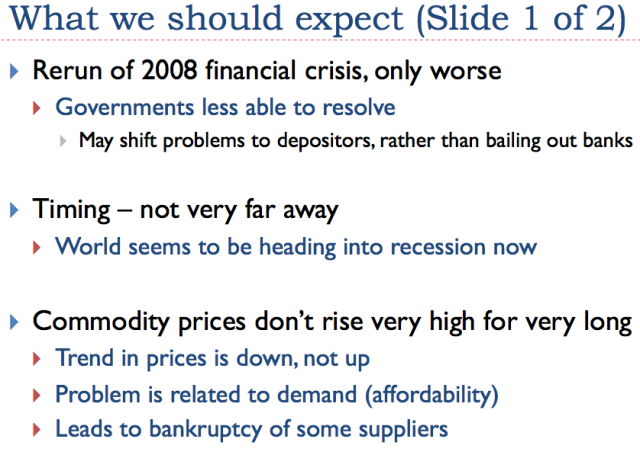
By the time the crash does come around, it is likely to be a huge one, affecting many segments of the economy at once. Oil exporters and exporters of other commodities will be especially affected. Some of them, such as Venezuela, Yemen, and even Iraq may collapse. Financial institutions are likely to find themselves burdened with many “underwater loans.” The usual technique of lowering interest rates to try to aid the economy doesn’t look like it would work this time, because rates are already so low. Governments are not in sufficiently good financial condition to be able to bail out all of the banks and others needing assistance. In fact, governments may fail. The fall of the former Soviet Union occurred when oil prices were low.
Once there are major debt defaults, lenders will want to wait to see that prices will stay consistently high for a period (say, two or three years) before extending credit again. Thus, even if commodity prices should bounce back in 2017, it is doubtful that producers will be able to find financing at a reasonable interest rate until, say, 2020. By that time, depletion will have taken its toll. It will be impossible to make up for the many years of low investment at that time. Production is likely to continue falling, even if prices do rise.
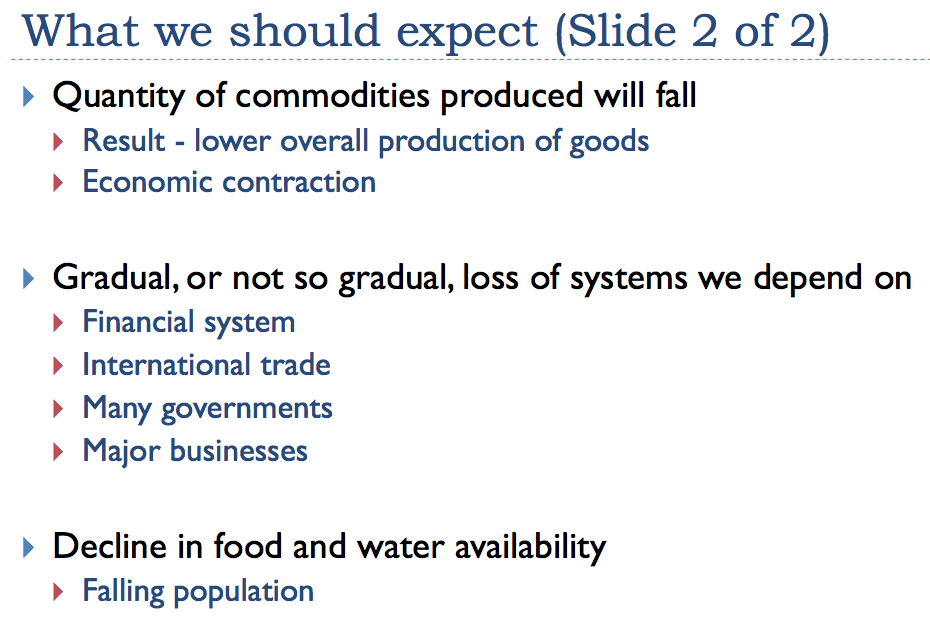
The indirect impact of low oil and other commodity prices is likely to be a collapse in our current debt bubble. This collapsing bubble may lead to the failures of banks and even governments. It seems quite possible that these indirect impacts will affect us most, even more than the direct loss of commodities. These impacts could come quite quickly–in the next few months, in some cases.
 Slide 35
Stocks, bonds, pension programs, insurance programs, bank accounts, and many other things of a financial nature seem to be very “solid” things–things that we can expect to be here and grow, for many years to come. Yet these things, directly and indirectly, depend on the ability of our system to produce goods and services. If something goes terribly wrong, we may find that financial assets have little more value than the pieces of paper that represent them.
 Slide 36
I won’t try to explain Slide 36 further.
 Slide 37
Slide 37 illustrates the principle of increased efficiency. If a smaller amount of resources and human labor can be used to create a larger amount of end product, this is growing efficiency. If more and more resources and labor are used to produce a smaller amount of end product, this is growing inefficiency.
The other part of the story is that simply automating processes is not enough. Instead, the economy must also produce a sufficiently large number of jobs, and these jobs must pay high enough wages that the workers can afford to buy the output of the economy. It is really the health of the whole interconnected system that is important.
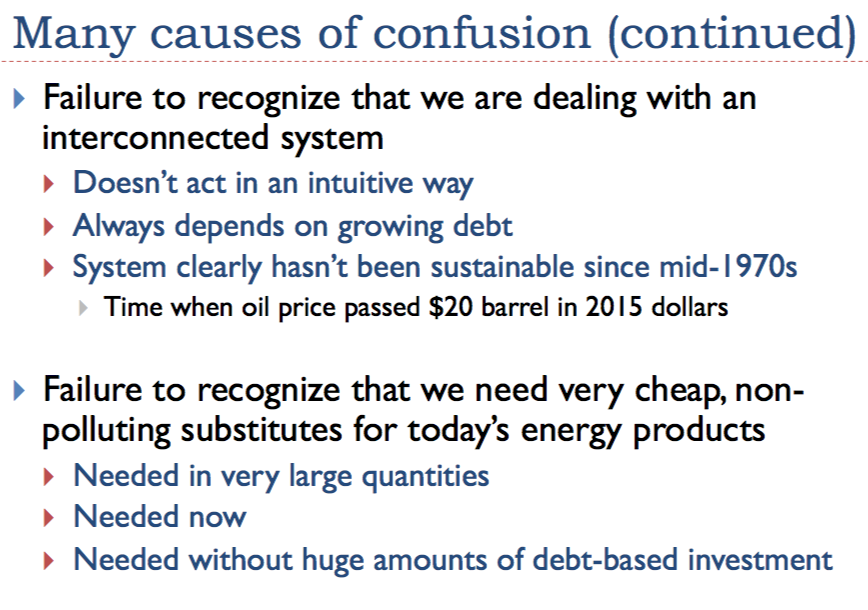
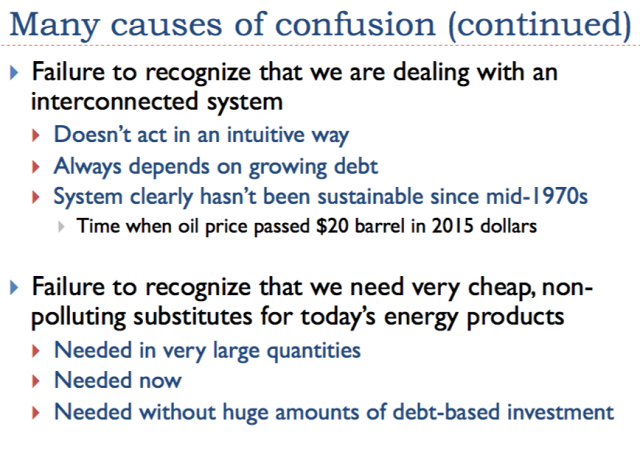 Slide 38
Our low price problems are here now. That is why we need very cheap non-polluting energy products now, in large quantity, if there is any chance of fixing the system. These energy products must work in today’s devices, so we aren’t faced with the cost and delay involved with changing to new devices, such as cars and trucks that use a different fuel than petroleum.
 Slide 39
Regarding Slides 39 and 40, we are sitting on the edge, waiting to see what will happen next.
The US economy temporarily seems to be in somewhat of a bubble, now that it does not have QE, while several other countries still do. This bubble is related to a “flight to quality,” and leads to a higher dollar, relative to other currencies. It also leads to high stock market valuations. As a result, the US economy seems to be doing better than much of the rest of the world.
Regardless of how well the US economy seems to be doing, the underlying problems of rising costs of producing commodities and prices that lag below the cost of production are still present, making the situation unstable. Wages continue to lag behind as well. We should not be too surprised if the economy starts taking major downward steps in the next few months.
 Slide 40
ABOUT THE AUTHOR
Gail Tverberg is an actuary interested in finite world issues - oil depletion, natural gas depletion, water shortages, and climate change. Oil limits look very different from what most expect, with high prices leading to recession, and low prices leading to inadequate supply.
|
The traditional understanding of supply and demand works in some limited caseswill a manufacturer make red dresses or blue dresses? The manufacturers choice doesnt make much difference to the economic system as a whole, except perhaps in the amount of red and blue dye sold, so it is easy to accommodate.
A gradual switch in consumer preferences from beef to chicken is also fairly easy to accommodate within the system, as more chicken producers are added and the number of beef producers is reduced. The transition is generally helped by the fact that it takes fewer resources to produce a pound of chicken meat than a pound of beef, so that the spendable income of consumers tends to go farther. Thus, while supply and demand are not independent in this example, a rising percentage of chicken consumption tends to be helpful in increasing the quantity demanded, because chicken is more affordable than beef. The lack of independence between supply and demand is in the helpful direction. It would be different if chicken were a lot more expensive to produce than beef. Then the quantity demanded would tend to decrease as the shift was increasingly made, putting a fairly quick end to the transition to the higher-priced substitute.
A gradual switch to higher-cost energy products, in a sense, works in the opposite direction to a switch from beef to chicken. Instead of taking fewer resources, it takes more resources, because we extracted the cheapest-to-extract energy products first. It takes more and more humans working in these industries to produce a given number of barrels of oil equivalent, or Btus of energy. The workers are becoming less efficient, but not because of any fault of their own. It is really the processes that are being used that are becoming less efficientdeeper wells, locations in the Arctic and other inhospitable climates, use of new procedures like hydraulic fracturing, use of chemicals for extraction that wouldnt have been used in the past. The workers may be becoming more efficient at drilling one foot of pipe used for extraction; the problem is that so many more feet need to be drilled for extraction to take place. In addition, so many other steps need to take place that the overall process is becoming less efficient. The return on any kind of investment (human labor, US dollars of investment, steel invested, energy invested) is falling.
For a time, these increasing inefficiencies can be hidden from the system, and the prices of commodities can rise. At some point, however, the price rise becomes too great, and the system can no longer accommodate it. This is the situation we have been running into, most severely since mid-2014 for oil, but also for other commodities, dating back to 2011.
The economy is in a sense more dependent on energy products than it is on our decision whether to eat chicken or beef. If the cost of producing oil rises, and that higher cost is carried through to prices, it affects the prices of many things. It affects the cost of food production because oil is used in the production and transport of food. The higher cost of oil also affects nearly all transported goods, since oil is our primary transportation fuel.
If higher oil costs are passed on to consumers as higher prices, these higher prices make goods less affordable for consumers. As a result, they cut back on purchases, often leading to layoffs in discretionary sectors, and recession.
The higher cost of oil products (or of other energy products) also tends to reduce profits for businesses, unless they can find workarounds to keep costs down. Otherwise, businesses find themselves in a situation where customers cut back on purchasing their products. As we will discuss in a later section, this tends to lead to reduced wages.
Rising oil prices clearly encourage rising oil production. With this, more jobs are added, both in the United States and elsewhere. More debt is added to extract this oil, and more equipment is purchased, thus stimulating industries that support oil production. The value of oil leases and oil properties tends to rise.
As noted previously, the cost of food supply depends on oil prices. The cost of producing metals also depends on oil prices, because oil is used in extracting metal ores. As the prices of metals and foods rise, these industries are stimulated as well. Values of mines rise, as do values of agricultural land. More debt is taken out, and more workers are hired. More equipment is purchased for producing these products, adding yet more stimulation to the economy.
The higher price of oil also favorably affects the many countries that extract oil. Part of this effect comes from the wages that the workers receive, and the impact these wages have, as they cycle through the economy. For example, workers will often want new homes, and the purchase of these new homes will add jobs as well. Part of the effect comes through taxes on oil production. Oil production tends to be very highly taxed, especially in parts of the world where oil extraction can be performed cheaply. This tax money can be put to work in public works programs, providing better schools and hospitals, and more jobs for citizens.
The adverse impact of higher oil prices on the spendable income of consumers comes in many ways. Perhaps one of the biggest impacts, but the least obvious, is the push the higher cost of oil gives to moving manufacturing to locations with lower costs (cheaper fuel, such as coal, and lower wages), because without such a change, higher oil prices tend to lead to lower profits for many makers of goods and services, as mentioned previously.
The competition with lower-wage areas tends to reduce wages in the US and parts of Europe. This push is especially great for jobs that are easily transferred to other countries, such as jobs in manufacturing, call-centers, and computer tech support.
Another way businesses can maintain their profit levels, despite higher oil costs, is through greater automation. This automation reduces the number of jobs directly. Automation may use some oil, but because the cost of human labor is so high, it still reduces costs overall.
All of these effects lead to fewer jobs and lower wages, especially in the traditionally higher-wage countries. In a sense, what we are seeing is lower productivity of human labor feeding back as lower wages, if we think of the distribution of wages as being a worldwide wage distribution, including workers in places such as China and India.
Normally, greater productivity feeds back as higher wages, and higher wages help stimulate higher economic growth. Lower wages unfortunately seem to feed back in the reverse directionless demand for goods that use energy in their production, such as new homes and cars. Ultimately, this seems to lead to economic contraction, and lower commodity prices. This is especially the case in the countries with the most wage loss.
Oil exporting countries typically have relatively low costs of production, but very high taxes. These taxes are necessary, because governments of oil exporters tend to be very dependent on oil companies for tax revenue. If the price of oil drops, the most adverse impact may be on tax revenue. As long as the price is high enough that it leads to the collection of some tax revenue, production will take placein fact, production may even be increased. The government desperately needs the tax revenue.
Even oil companies in oil-importing countries have a need for revenue to pay back debt and to continue to pay their trained workers. Thus, these companies will continue to extract oil to the best of their ability. They will aim for the sweet spotsplaces that have better than average prospects for production. In some cases, companies will have derivative contracts that assure them of a high oil price for several months after the price drops, so there is no need to reduce production very quickly.
We earlier noted that a rise in the price of commodities tends to make asset prices rise, making it easier to take out more debt, and thus stimulates the economy. A drop in the price of oil or other commodities does the opposite: it reduces asset prices, such as the price of the property containing the oil, or the farmland now producing less-expensive food. The amount of outstanding debt does not decline. Because of this mismatch, companies quickly find themselves with debt problems, especially if they need to take out additional loans for production to continue.
Another part of the problem is that on the way up, rising prices of oil and other commodities helped lift inflation rates, making debt easier to repay. On the way down, we get exactly the opposite effectfalling oil and other commodity prices lead to falling inflation rates, making debt more difficult to repay. Commodity prices in general have been falling since early 2011, leading to the situation where interest rates are now negative in some European countries.
The costs of producing commodities continue to rise, as a result of diminishing returns, so this fall in prices is clearly a problem. Low prices make future production unprofitable; it also leads to an increasing number of debt defaults. There are many examples of companies in financial difficulty; Chesapeake Energy is an example in the oil and gas industry.
The traditional view of the impact of low oil prices seems to be, It is just another cycle. Or, The cure for low prices is low prices.
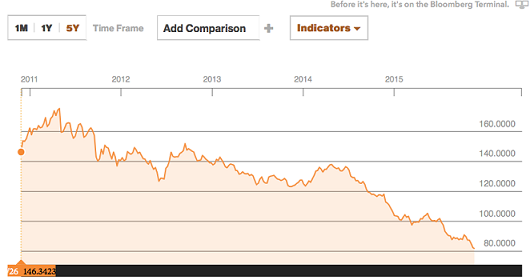
I am doubtful that either of these views is right. Falling prices have been a problem for a wide range of commodities since 2011 (Figure 2, above). The Wall Street Journal reported that as early as 2013, when oil prices were still above $100 per barrel, none of the worlds super major oil companies covered its dividends with cash flow. Thus, if prices are to be sufficiently high that oil companies dont need to keep going deeper into debt, a price of well over $100 per barrel is needed. We would need an oil price close to triple its current level. This would be a major challenge, especially if prices of other commodities also need to rise because production costs are higher than current prices.
We are familiar with illnesses: sometimes people bounce back; sometimes they dont. Instead of expecting oil prices to bounce back, we should think of the current cycle as being different from past cycles because it relates to diminishing returnsin other words, the rising cost of production, because we extracted the cheapest-to-extract oil first. Trying to substitute oil that is high in cost to produce, for oil that is low in cost to produce, seems to bring on a fatal illness for the economy.
Because of the differing underlying cause compared to prior low-price cycles, we should expect oil prices to fall, perhaps to $20 per barrel or below, without much of a price recovery. We are now encountering the feared Peak Oil, because much of the cheap oil has already been extracted. Peak Oil doesnt behave the way most people expected, though. The economy is a networked system, with high oil prices adversely affecting both wages and economic growth. Because of this, the symptoms of Peak Oil are the opposite of what most people have imagined: they are falling demand and prices below the cost of production.
If low prices dont rise sufficiently, they can cut off oil production quite quicklymore quickly than high prices. The strategy of selling assets at depressed prices to new operators will have limited success, because much higher prices are needed to allow new operators to be successful.
Perhaps the most serious near-term problem from continued low prices is the likelihood of rising debt defaults. These debt defaults can be expected to have a very adverse impact on banks, pension plans, and insurance companies. Governments would likely have little ability to bail out these organizations because of the widespread nature of the problem and also because of their own high debt levels. As a result, the losses incurred by financial institutions seem likely be passed on to businesses and individual citizens, in one way or another.


![[groups_small]](groups_small.gif)