This article presents the results of the SSI-2014. It comprises four chapters:
1) A short description of the Sustainable Society index, SSI.
2) The results for the world in 2014 (though most data are of 2012), per indicator, per wellbeing dimension, per region and per income class.
3) Progress over time since the first edition of the SSI in 2006, again per indicator, per wellbeing dimension, per region and per income class.
4) The correlation between Human and Environmental Wellbeing, since this correlation appears to be of major importance to enable humankind to achieve a sustainable society.
1. Short description of the Sustainable Society Index, SSI
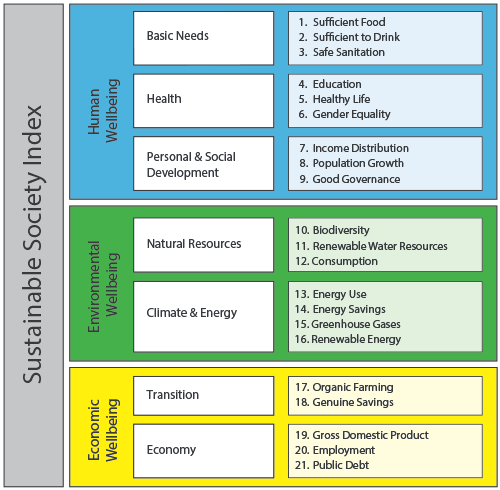
The Sustainable Society Index, SSI, is published every two years since 2006. By the end of 2014 the new update SSI-2014 (www.ssfindex.com) has been presented. The SSI shows at a glance the level of sustainability of 151 countries, comprising 99% of the world population. The SSI consists of 21 indicators, covering the three wellbeing dimensions Human, Environmental and Economic Wellbeing.
All data are retrieved from public sources: FAO, Aquastat, Unesco, World Bank, IEA, ILO, IMF, World Economic Forum, UNEP-WCMC, Global Footprint Network, FiBL.
In 2012 the Joint Research Centre (JRC) of the European Commission has audited the SSI. JRC concluded that the SSI framework is conceptually coherent, meets the statistical requirements set by JRC and that the SSI is well suited to assess nations development towards sustainability in its broad sense: Human, Environmental and Economic Wellbeing.
2. The world in 2014
2.1 Indicator scores
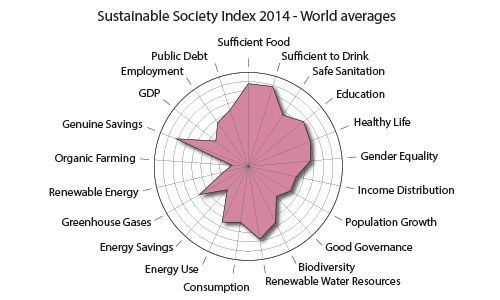
The spider web shows the scores for each of the 21 indicators on a scale of 1 to 10. The centre of the web is a score of 1: no sustainability, the outer circle expresses full sustainability, a score of 10. All average scores are weighted for the population size of each country.
|
The picture clearly shows that, like in previous years, Sufficient Food and Sufficient to Drink have the best average scores, in spite of millions of people worldwide living under most difficult circumstances: over 800 million people are lacking sufficient food and safe drinking water, 2,5 billion have no access to safe sanitation. So very rightly, all three indicators are major concerns within the Millennium Development Goals and their successors, the Sustainable Development Goals.
The minimum scores for the world as a whole are for Renewable Energy and Organic Farming. In spite of all good intentions and targets which have been set nationally as well as internationally, the scores for Renewable Energy, Energy Savings as well as Greenhouse Gases and Energy Use are dramatically low. (Notice that a low score for e.g. Greenhouse Gases indicates a high emission of these gases.)
Be not misled by the comparatively high average score for Renewable Water Resources. That would be OK if the distribution of water resources would be more equal around the globe, which is not the case. On the contrary. Once more, this emphasizes the necessity to always look at the underlying figures as well.
A detailed look at the spider webs is recommended. One will see at a glance which indicators need attention most urgently. Many indicators give room for improvement, to say the least of it.
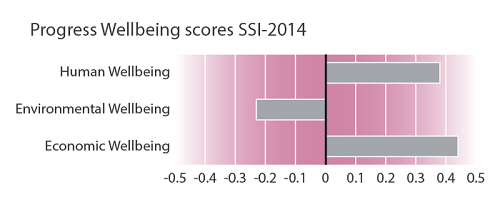
2.2 Wellbeing scores
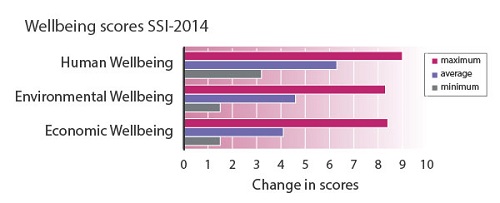
The world average scores for the three wellbeing dimensions are shown below, including the world-wide maximum and minimum scores.
One might conclude that the average score for Human Wellbeing is more or less sufficient, albeit way below a sustainable score of 10. However, when looking in more detail one notices the large spread between maximum and minimum score. The same applies to the two other dimensions, Environmental and Economic Wellbeing. So there is not any reason to just lean back, satisfied by the average results.
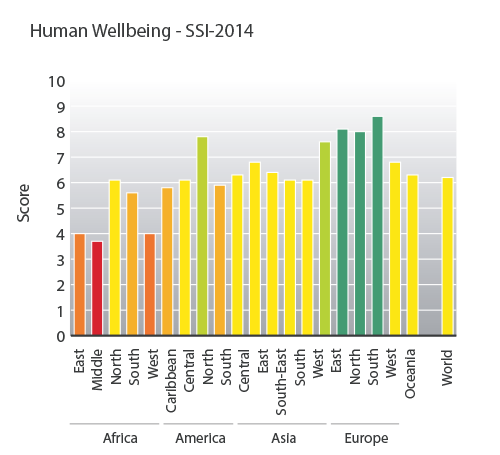
2.3 Regions
To get an idea of the regional differences the scores for the three wellbeing dimensions are shown in the graphs below, for each of the 19 United Nations regions, including the world averages.
Not surprisingly, Europe (North, West and South) and North America show the highest scores for Human Wellbeing. Africa (Middle, West and East) has by far the lowest scores. This is mainly due to low scores for Population Growth, as well as Safe Sanitation, Good Governance, Income Distribution and Healthy Life.
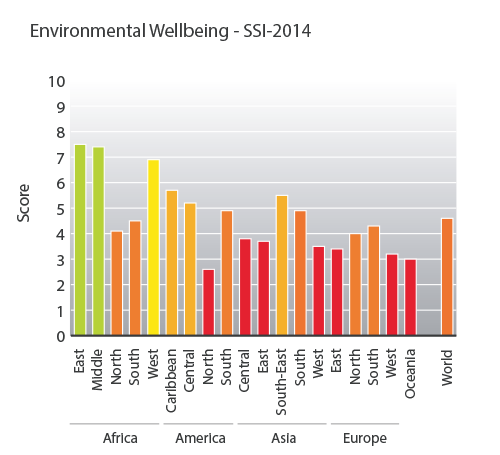
The picture for Environmental Wellbeing is totally different from the one for Human Wellbeing. To some extent, the two pictures seem to be each others reverse. Africa is performing - comparatively - rather well. No less than three African regions present the highest scores. North America and Oceania as well as Western Europe show the lowest scores.
Economic Wellbeing again presents a different picture, with lowest scores for the five African regions, Central and Southern Asia and maybe surprisingly North America. The latter is due to bad scores for Public Debt and Organic Farming. The highest scores are for Oceania and Central America.
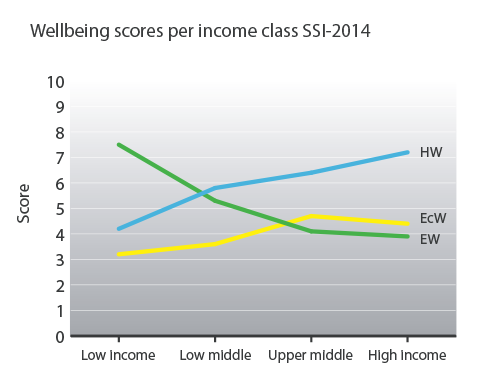
2.4 Income class
Another way of examining the results is to look at the scores per income level of the various countries, clustered in accordance with the definition of income classes of the World Bank (Data of 2013, World Bank - 2014). Below the results for the three wellbeing dimensions are presented.
Not unexpectedly, the picture clearly shows the increasing Human Wellbeing and the decreasing Environmental Wellbeing for increased income. This doesnt necessarily mean that there is a causal correlation between the two, but it is at least suggestive and needs further examination.
3. Progress 2006 2014
Now that five editions of the SSI have been published, one can see to what extent progress has been achieved on the way towards a sustainable society during this 8 year period.
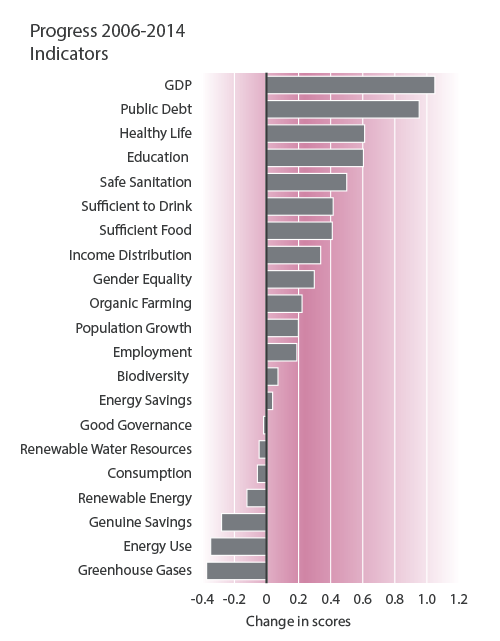
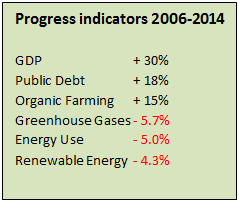
3.1 Indicators progress
The scores of 14 indicators show progress, 7 are in decline. By far GDP has grown most of all indicators, followed surprisingly by Public Debt. In spite of all good intentions the indicator values of Renewable Energy, Energy Use and Greenhouse Gases are all three in decline, while Energy Savings is more or less even over this period.
8 out of 9 indicators for Human Wellbeing have shown progress, 1 stayed even. That is a very nice result, if it were not at the cost of the environment. Moreover, we ascertain that Genuine Savings has faced a decline. This is a serious drawback since Genuine Savings indicates the ability to maintain the current level of wellbeing and sustainability in the near and distant future. It is certainly worthwhile to give these developments some extra thought.
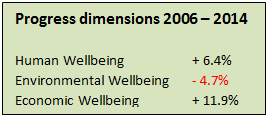
3.2 Wellbeing dimensions progress
The level of Human Wellbeing as the weighted average of all countries has increased by nearly 0.4, from a score of 5.9 to 6.3, which is 6.4% in 8 years. That is not an outstanding figure, but it makes a lot of a difference for many people. Environmental Wellbeing was in decline from 4.9 to 4.6, i.e. by 4.7%, whereas Economic Wellbeing increased by no less than 11.9% from 3.7 to 4.1.
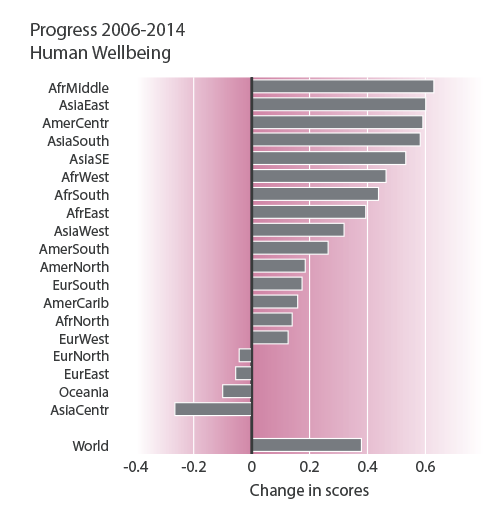
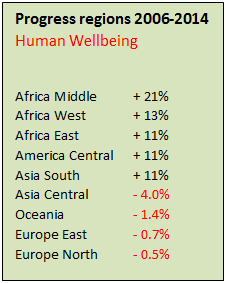
3.3 Progress per region
The good news is the increase of Human Wellbeing for all African regions and Asian regions but one. Should we express progress in %, than the increase would be even much more pronounced in comparison with the high-developed countries.
While Human Wellbeing in the world as a whole has increased during the assessed period, 4 of the 19 regions have faced a decrease, most of all Central Asia. This is caused by a decline for Population Growth (-2.3), Income Distribution (-0.6) and Education (-0.1). Oceania (declining values for Population Growth (-0.7) as well as Safe Sanitation, Education and Good Governance), Eastern Europe (Population Growth and Income Distribution) and Northern Europe (Population Growth, Good Governance and Education) also saw decreasing levels of Human Wellbeing.
|
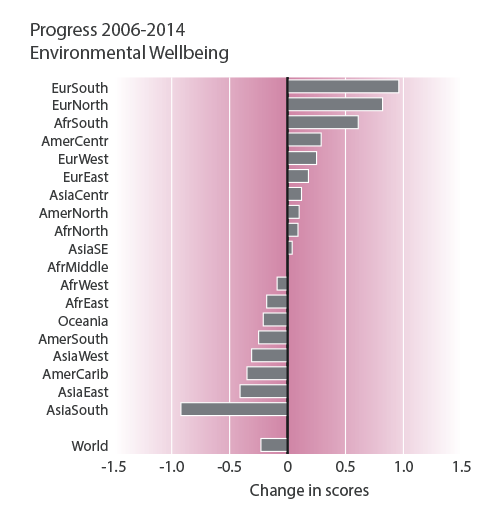
As already said the (weighted) average of all countries of Environmental Wellbeing has decreased over the last 8 years. Nevertheless 10 regions have made progress, 8 are in decline and 1 stayed even. Southern Europe has made the largest progress, in particular due to the increase of the scores for all four indicators of Climate & Energy.
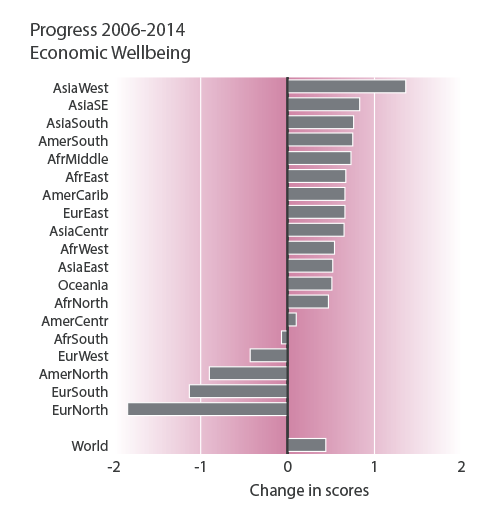
With respect to Economic Wellbeing North America and Europe, excluding Eastern Europe, present by far the steepest decline. A smaller decline can be noticed for Africa South. Poorer countries are performing much better with respect to Economic Wellbeing, in particular Asia West, due to a much better performance for Public Debt than 8 years before.
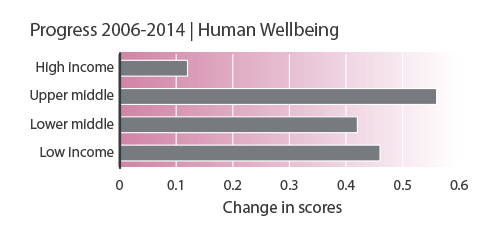
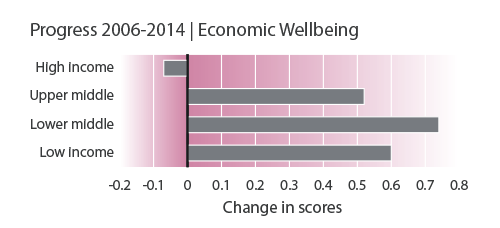
3.4 Progress per income class
The good news is that Human Wellbeing has increased for all income classes. The high income class presents the smallest progress maybe because of the already comparatively high level of Human Wellbeing.
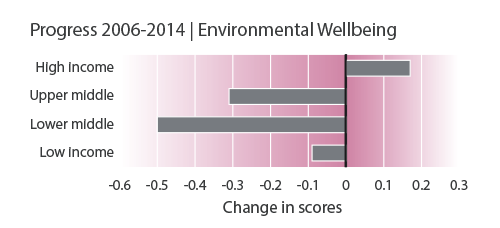
The bad news is that Environmental Wellbeing is in decline for all income classes except high income. The little progress of the latter is caused by improved scores for the four indicators of Climate & Energy. The sharp decline of Environmental Wellbeing of the countries of the two middle income classes is mainly due to a decreased score for nearly all indicators of Climate & Energy.
A most important question is whether one may draw conclusions with respect to the progress of Environmental Wellbeing in high income countries. Could it be that a country has to be rich enough to spend enough money on the protection of the environment? We have seen this phenomenon already years ago with respect to pollution.
The comparatively large progress for Economic Wellbeing of Lower middle income countries is mainly the result of an increase of the scores for Public Debt and GDP and in spite of a substantial decrease of the Genuine Savings score.
4. Correlation Human Wellbeing and Environmental Wellbeing
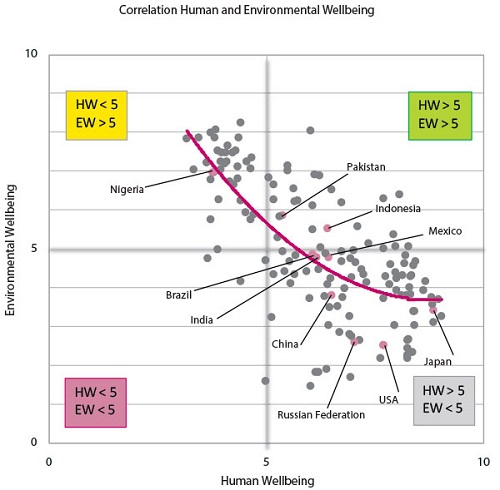
Above we have seen that Human Wellbeing has made some progress over the past 8 years and that at the meantime, Environmental Wellbeing was in decline. What does this mean? Lets examine the correlation between Human and Environmental Wellbeing. First of all well show the picture of the scores of Human and Environmental Wellbeing for the 151 countries included in the SSI-2014. The countries with a population over 100 million, are marked in this picture.
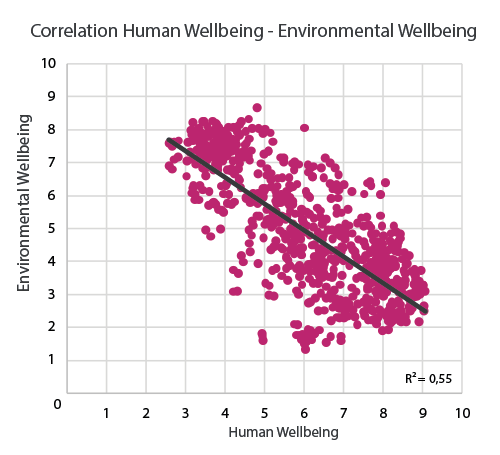
In the next picture the scores for Human Wellbeing and Environmental Wellbeing for each of the five editions of the SSI are presented.
In this figure a linear trend line has been inserted. This line shows a distinct downward trend for Environmental Wellbeing at higher scores for Human Wellbeing. This lends credibility to the common opinion that Human Wellbeing and Environmental Wellbeing are at collision course. Nevertheless, we can also see that not all countries perform according to the average trend. Some are doing better, some are doing worse.
The R2 value, a statistical figure to express the level of correlation, of 0.55 indicates that the correlation is statistically strong. However, this doesnt necessarily mean that the correlation is a causal one. This requires further research. We have already done some research ourselves on this issue.
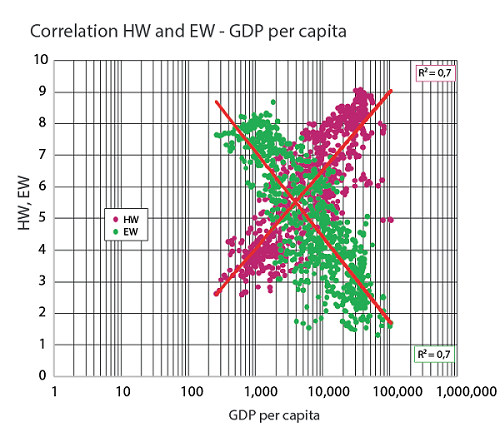
We have correlated the two dimensions HW and EW with a number of variables: Income, GDP per capita, Population size, Population density, Area size and Natural resources rents. First well have a look at the correlation with Income.
This looks quite serious. The two R2 values of about 0.7 indicate a statistically strong correlation for HW as well as EW with GDP per capita. But again, this doesnt mean that the correlation is a causal one.
The other correlations we have assessed all appear to be statistically (very) weak. Alas, the results of our study are thus not enough to unmistakably identify the causes of the strong correlations with GDP per capita, however suggestive they are. The present set of data is appropriate as a basis for further study, e.g. to examine correlations in more detail and explore other possible explanations. Therefore we would like to call researchers to further undertake this study. We are most willing to supply anyone with the data over the years covered so far of the SSI. Moreover, it might be necessary not only to examine the data but to look in other directions as well: What is the role of a countrys policy with respect to sustainable development? Is this well imbedded in government programs and has it been implemented? What role is played by the civil society and industry?
Such detailed study should reveal the role that various aspects play in the correlation between Human Wellbeing and Environmental Wellbeing. It should also answer the question whether a collision between Human Wellbeing and Environmental Wellbeing can be avoided and if so, how this can be achieved.
In spite of the lack of a scientifically sound analysis and conclusion many people expect that
- Higher income leads to higher Human wellbeing
- Higher income leads to lower Environmental wellbeing
- Increasing population size leads to higher pressure on the bearing capacity of our one and only planet.
Are these developments unavoidable? Possibly not, provided one really wants to avoid them. Maybe our political leaders need a bit more pushing in the right direction? Civilians are the most powerful community on earth. Dont hesitate to use this power.
Note: All data are available on the website of the Sustainable Society Index as well as the interactive maps. One can make its own selection of data, comparisons, correlations and much more. For further information, reactions and comments please contact geurt.vandekerk@ssfindex.com.
ABOUT THE AUTHOR
Geurt van de Kerk is chairman of the Sustainable Society Foundation. Mr Van de Kerk received his M.Sc. degree in civil engineering at Delft Technical University in 1969. Subsequently he held several positions as management consultant in the Netherlands and abroad until he co-founded K+V Management Consultants in Arnhem, The Netherlands, in 1984. He worked with the firm as managing director until 1997, when his personal interest in the publishing business led him to setting up De Vijver Publishing. This company offers little known writers of quality literature the opportunity to publish their work. Furthermore, since leaving K+V he has also undertaken various management consulting assignments for business and cultural organizations. Mr. Van de Kerk is a member of a number of national and international organizations, among which the European Sustainable Development Network, ESDN, and the International Society of Ecological Economists, ISEE. In the course of his career he has gained working experience in various countries outside Europe, viz. Guyana, Iran, Netherlands Antilles, Nigeria, Sri Lanka, Surinam, Trinidad and Turkey
|


![[groups_small]](groups_small.gif)