
|
Mother Pelican
A Journal of Sustainable Human Development
Vol. 6, No. 11, November 2010
Luis T. Gutierrez, Editor
|
|
|
|

|
|
|
|
Sustainable Development Simulation (SDSIM) Version 1.2
|
|
SUMMARY
The objective of the Sustainable Development Simulation (SDSIM) is to analyze trade-offs between human development and economic development priorities, with special focus on the human-nature interfaces. Within a social-economic-ecological context, the objective is to model human behavior and decision making profiles as functions of financial capital, social capital, human capital, and ecological capital. It attempts to take into account both material resources, which are limited, and human resources such as human wisdom, which are unlimited. The time window is 1950-2200, and the transition from consumerism to sustainability is expected to happen during the 21st century (i.e., approximately 2010-2100).
SDSIM is a "data-poor" modeling project, and another objective is to provide a focal point for psychologists and other experts in human behavior to collaborate in filling the data gaps. For instance, statistically significant data (or some objective evidence, even if it is just in narrative form) is needed to derive functional relationships in which the independent variable is some metric of human well-being (for example, the UN Human Development Index, or the percent of the population that has attained the upper levels of Maslow's Hierarchy of Needs) and the dependent variable is the propensity of human decisions to take into account the "common good" (as manifested, for example, in a propensity to mitigate excessive consumption, a propensity to take good care of the human habitat, and political will to reduce the rich/poor gap).
SDSIM is a System Dynamics model, and it is programmed in the STELLA simulation language. Links are provided velow to references and applications of the System Dynamics method and an excellent System Dynamics Primer. However, it is assumed that the reader is familiar with the System Dynamics method of system analysis and synthesis. Documentation of the model is provided below in 9 sections, as follows:
1. The Sustainable Development Paradox
2. Sustainable Development Simulation Scenarios
3. SDSIM Version 1.2 Causal Loop Diagram
4. SDSIM Version 1.2 Detailed Model Diagram
5. SDSIM Version 1.2 Mathematical Formulation
6. SDSIM Version 1.2 User Interface
7. SDSIM Version 1.2 Simulation Results
8. Comparative Analysis & Synthesis
9. Limitations & Pending Issues
This page provides an introduction and general overview of the SDSIM Version 1.2. The model documented herein is still a test model intended for review and feedback pursuant to subsequent development of more mature models (specially with regard to human decision functions), and eventually a fractal decomposition into global, national, and local levels.
SYSTEM DYNAMICS METHOD: The system dynamics method is minimally described - in conjunction with the general description of the SDSIM - in Sections 3 to 8 of this page. Readers who are unfamiliar with the system dynamics method may want to explore the following online resources:
Principles of Systems, Jay W. Forrester, Wright-Allen Press, 1968.
Counterintuitive Behavior of Social Systems, Jay W. Forrester, MIT, Tech Review, 1971.
The Limits to Growth, Meadows & Meadows, MIT, 1972
Feedback dynamics of secondary succession in ecosystems, Gutierrez & Fey, PNAS, 1975.
Ecosystem Succession, Gutierrez & Fey, MIT Press, 1980.
The Energy Transition and the Economy, John Sterman, MIT, 1982.
Beyond the Limits to Growth, Meadows & Meadows, Context Institute, 1992
System Dynamics Mega Link List, G. Ossimitz, Universität Klagenfurt, started 1997.
Intellectual Roots and Philosophy of System Dynamics, Willard R. Fey, EOLSS, 2001.
System Feedback Modeling for Policy Analysis,
Yaman Barlas, EOLSS, 2002.
System Dynamics Model Library, Tom Fiddaman, MetaSD, started 2002.
Limits To Growth: The 30-Year Update, Meadows & Meadows, Sustainability Institute, 2004.
Introduction to Systems Thinking, Barry Richmond, ISEE Systems, 2004.
The Energy Perspective: Oil and the Magical 4%, Fey, Gutierrez & Lam, EDL, 2005.
System Dynamics Society (SDS), Roberta Spencer, University of Albany, NY, 2010.
System Dynamics Review, John Wiley & Sons, 1985-2010.
Tracing Connections, Edited by Joy Richmond et al, ISEE Systems, 2010.
Change resistance as the crux of the environmental
sustainability problem, Jack Harich, System Dynamics Review, January 2010.
LINK TO REFERENCES & DATA SOURCES: Directory of Sustainable Development Resources
NOTE: Any suggestion for improving the definition of modeling requirements, the model design and formulation, the user interface, and the analysis and synthesis of the simulation results would be most welcome. To submit comments/suggestions/corrections please contact the journal editor.
|
FREE DOWNLOAD: To download the SDSIM 1.2 model, click on the button to the right. SDSIM requires STELLA 9.1.3 or higher. Readers who do not have the STELLA software can download a free one month trial from ISEE Systems.
|

|
|
|
1. The Sustainable Development Paradox
|
Sustainable development is a paradoxical undertaking. Ceteris paribus, continued population growth and economic development (in the sense of human consumption) are bound to exacerbate the process of biosphere degradation and climate dislocations. But, limiting population growth and economic development in order to mitigate - let alone reverse - environmental degradation are bound to exacerbate vexing issues of financial stability, poverty eradication, and social justice:
|
"Our enormously productive economy
demands that we make consumption our way of life, that we convert the buying and use of goods into rituals, that we seek our spiritual satisfaction, our ego satisfaction, in consumption
We need things consumed, burned up, worn out, replaced, and discarded at an ever increasing rate." Victor Lebow, 1955
|
In his latest book, Agenda for a New Economy: From Phantom Wealth to Real Wealth, David C. Koster argues forcefully for the need to redesign our financial and economic systems so that they are at the service of "Main Street" rather than "Wall Street." Perhaps a new economic system can be designed so that the sustainable development paradox vanishes. But, at the moment, we must start where we are.
The best definition and visualization of the sustainable development paradox may be that produced at the turn of the century by Willard R. Fey and Ann C.W. Lam of Ecocosm Dynamics Ltd. They use both concise text and a masterful diagram to discuss the paradox. The diagram is reproduced below:
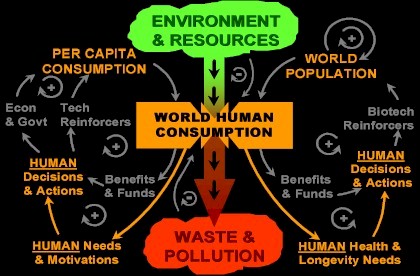
Visualization of the Sustainable Development Paradox
by Willard R. Fey and Ann C.W. Lam, Ecocosm Dynamics Ltd
Reprinted with Permission
The reader is invited to explore the following publications on the sustainable development paradox:
- An axiomatic approach to sustainable development, Graciela Chichilnisky, Columbia University; Social Choice & Welfare, 1996.
- Sustainable Development as a Paradox, Serge Latouche, University of Paris, 2003.
- The Paradox of Sustainability, Vladimir Dimitrov, Centre for Systemic Development of the University of Western Sidney Hawkesbury, Australia, 2003.
- Sustainable Development: Concepts and Approaches. See section on Tradeoffs, National Strategy for Sustainable Development (NSSD), 2003.
- Characterizing and measuring sustainable development, Thomas M. Parris and Robert W. Kates, Annual Review of Environment and Resources, 28:559-586, 2003.
- The Sustainable Development Paradox: Urban Political Economy in the United States and Europe , Rob J. Krueger & David Gibbs (Editors), Guilford Press, 2007.
Resolving the sustainable development paradox is the crucial task of the 21st century!
|
2. Sustainable Development Simulation Scenarios
|
A simulation scenario for the transition from consumerism to sustainability must include the recent past, the transition phase, and the long term future. For example:
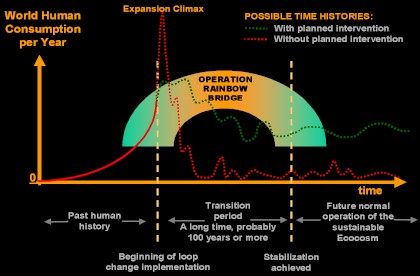
Visualization of the Transition from Consumerism to Sustainability
by Willard R. Fey and Ann C.W. Lam, Ecocosm Dynamics Ltd
Reprinted with Permission
In their conceptual scenario, Fey and Lam suggest 100 years for the transition phase, which they refer to as "Operation Rainbow Bridge."
In that the transition will entail institutional reformations and cultural evolution, 100 years (3 generations) is a very reasonable estimate. However, the decline in human consumption following the "expansion climax" might seem to be a bit too fast unless the "expansion climax" brings the global economic system to the point of total collapse. They show two possibilities: the red curve would seem to suggest an irreversible total collapse in which only a "remnant" of humanity remains alive during and beyond the transition phase. The green curve suggests that the collapse can be mitigated by human responsiveness and ecological resilience. After a crisis of such magnitude, it seems reasonable that both the green and red curves show some oscillations persisting for a long time. Things are never perfectly smooth during steady-state conditions, let alone during a growth-followed-by-collapse situation.
There are thousands of sustainable development scenarios floating around the web, and they show every conceivable level of maturity, i.e., number of persons-years invested in their development, allowance for variations, reproducibility, documentation, etc. A set of scenarios that have been under development since the early 1990s - initially by the Global Scenario Group (GSG) and more recently by the Great Transition Initiative (GTI) - may be the best set of scenarios to work with. They provide a range of possible scenarios, each one supported by a comprehensive database. The GSD/GTI taxonomy of scenarios is a follows:
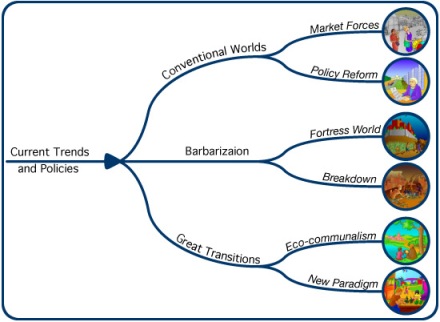
Taxonomy of the GSG/GTI Scenarios
P.Raskin, et al. Tellus Institute, 2008
Reprinted with Permission
For more information on these scenarios, see the following:
Global Scenario Results
Great Transition: The Promise and Lure of the Times Ahead
Global Scenarios for the Century Ahead: Searching for Sustainability
The reader may want to visit this taxonomy of scenarios and click on each one to see the supporting documentation, then proceed to the Global Scenario Results to explore the various options for retrieval of data pertaining to eleven regions (Africa, China+, Eastern Europe, FSU, Latin America, Middle East, North America, Pac OECD, South Asia, Southeast Asia, Western Europe, OECD regions, Non-OECD regions, and the World) and 105 variables related to demographics, economics, society, energy usage, agriculture, land use, water resources, air emissions, and solid waste. This may be the best set of scenarios for analysis of global/regional sustainable development futures.
The "conventional worlds" scenarios assume that the past will continue into the future; not a very realistic option. The "barbarization" scenarios assume that, under the pressure of an increasingly degraded human habitat, human civilization will regress to widespread violence and the "survival of the fittest"; not a very attractive proposition. The "great transition scenarios" assume that we may have to do a lot of "muddling through" but in the end new social and economic paradigms will emerge that in the long term will lead to a new steady-state of sustainable harmony between humanity and the human habitat; this is the path chosen as "baseline" for the SDSIM. Specifically, within the context of the "great transition scenarios," the SDSIM is being developed to support the resolution of the sustainable development paradox by setting economic development priorities in such a way that they support, and in fact reinforce, the most critical human development priorities: "humans need bread to live, but cannot live by bread alone."
|
3. SDSIM Version 1.2 Causal Loop Diagram
|
NB: The causal loop diagrams for SDSIM 1.1 and 1.2 are the same.
In the system dynamics method, the most critical step is to identify the feedback loop structure that generates the dynamic behavior to be understood and, perhaps, modified to improve system behavior. The polarity of feedback loops can have positive, negative, or variable polarity. A feedback loop with positive polarity generates growth or degrowth. A feedback loop with negative polarity compensates for deviations and maintains the stability of the system at a given equilibrium state. A feedback loop with variable polarity can switch from positive to negative polarity (or vice versa) when certain conditions are met. Feedback loop systems generally contain nonlinear relationships that often generate complex behavior patterns over time. Readers who are not familiar with the system dynamics method are encouraged to study the excellent primer Introduction to Systems Thinking, by Barry Richmond, ISEE Systems, 2004.
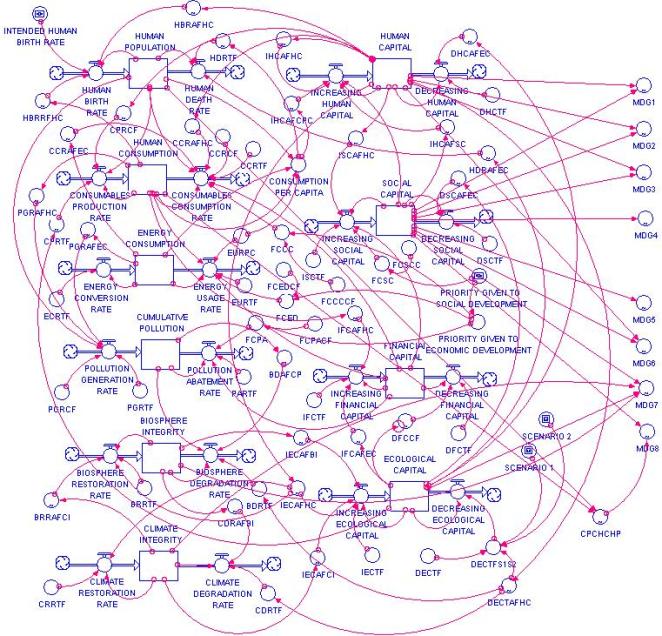
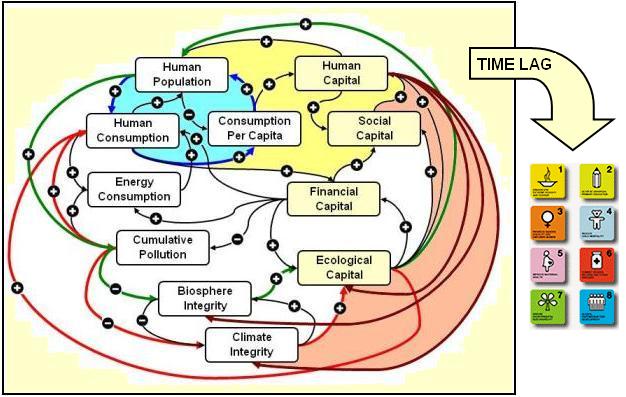
The causal loop diagram shown below attempts to capture, at a very high level, the essential feedback structure of the global system that must be dealt with during the transition from consumerism to sustainability. The arrows between any pair of nodes (say, A and B) show the assumed direction of causation between those nodes. Each causal link has a polarity - positive, negative, or variable. Arrows with a positive sign mean that if A increases, B increases, and if A decreases, B decreases. Arrows with a negative sign mean that if A increases, B decreases, and if A decreases, B increases. As any system dynamics practitioner knows, loops with zero or an even number of negative links have positive polarity and generate growth; and loops with an odd number of negative links have negative polarity and tend to maintain stability. So single loops are easy to understand. But when you are dealing with a plurality of loops with different polarities and interlocked in complex geometries, the modes of behavior arising from all the loops interacting together can become quite complex and hard to understand.
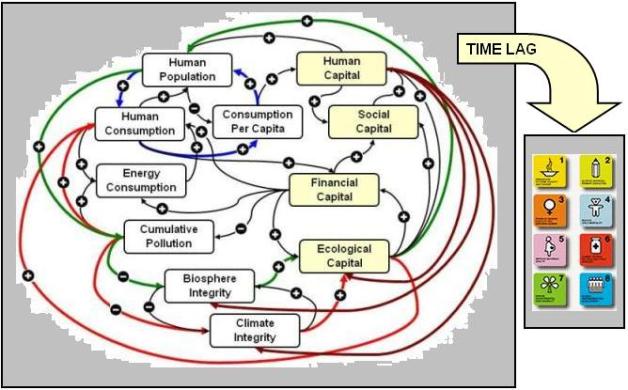
SDSIM Version 1.2 - Causal Loop Diagram + MDGs
NB: The causal loop diagrams for SDSIM 1.1 and 1.2 are the same.
Arrows between any pair of nodes A and B show the assumed direction of causation.
Arrows with a positive sign mean that if A increases, B increases, and if A decreases, B decreases.
Arrows with a negative sign mean that if A increases, B decreases and if A decreases, B increases.
|
Using the TouchGraph tool, the following links bring up a listing and relational map of web sites with content related to each of the above nodes:
Human Population,
Human Consumption,
Energy Consumption,
Cumulative Pollution,
Biosphere Integrity,
Climate Integrity,
Ecological Capital,
Financial Capital,
Social Capital,
Human Capital, and
Consumption per Capita.
The reader may want to explore web sites with content on related concepts such as
Human Development,
Social Development, and
Economic Development. The TouchGraph tool is also useful to find information and data related to
MDG1,
MDG2,
MDG3,
MDG4,
MDG5,
MDG6,
MDG7, and
MDG8.
|
Each node must be meaningful and measurable. Each link and each loop must describe how the nodes interact in the real world. Consider, for example, the loop highlighted in green, starting and ending in human population. This loop is a growth loop until growth reaches the limits of ecological capital (i.e., ecosystem services); then it remains positive but further growth is constrained. Next, consider the loop highlighted in red, starting and ending in human consumption. This loop is a negative loop, with climate integrity acting as the stabilizing factor. However, if climate integrity declines, the loop is weakened and may, in fact, become destabilizing. Finally, consider the loop highlighted in blue, starting and ending in human population. This is the mythical loop of economic growth; except that, if consumption per capita decreases and approaches zero, it would become the loop of rapid degrowth. These are the kinds of loops that have been analyzed extensively by Donella and Dennis Meadows in The Limits to Growth (1972, 1991, 2004).
The main focus of SDSIM, however, is on the interactions between the nodes highlighted in yellow: ecological capital, financial capital, social capital, and human capital. Ecological capital stands for ecosystem services. Financial capital is money (as opposed to real wealth). Social capital stands for the degree of social cohesion and solidarity. Human capital stands for the degree of human development as could be measured, for example, by the percentage of the population that has ascended to the fourth and fifth levels of Maslow's Hierarchy of Needs. During the transition from consumerism to sustainability, how should resources (financial and otherwise) be allocated to economic growth versus human development? From the perspective of sustainable development, which one is more important, economic development or human development?
|
4. SDSIM Version 1.2 Model Diagram
NB: SDSIM 1.2 is SDSIM 1.1 with an upgraded user interface and
supplementary equations to calculate the percent attainment of MDG targets.
The diagram below translates the causal loop diagram of the previous section into a detailed STELLA flow chart amenable to implementation as a computer simulation program. Briefly, the rectangles are levels (stocks, accumulations, integrations). The valves in the thick arrows are the rates (flows) that go into and out of the levels. When the inflow is greater than the outflow, the level grows. When the inflow is smaller than the outflow, the level declines. When the inflow and the outflow are the same, the level does not change. The circles are either constants (e.g., conversion factors) or functions used in the formulation of the rates as functions of the levels at each point in time. The thin arrows show how the rates are formulated as functions of the levels. In the SDSIM model, the unit of time is the calendar year, the starting time is 1950 and the ending time is 2200. Thus the recursive level-rate calculations are performed 250 times, corresponding to years 1950, 1951 .... 2199, 2200.
SDSIM Version 1.2 - Model Flow Diagram
NB: SDSIM 1.2 is SDSIM 1.1 with an upgraded user interface and supplementary equations for the MDGs.
RECTANGLES are LEVELS (cumulatives), VALVES are RATES (flows),
CIRCLES are variables or constants used to formulate the RATES as functions of the LEVELS
at TIME = t for the iteration t+dt, where t=1950, 1951, .... 2199, 2200 and dt=1.
The circles with the slider image inside are the two variables currently accessible to manipulation by users (via the user interface to be described in Section 6):
1. PRIORITY GIVEN TO HUMAN DEVELOPMENT
The objective of this user decision is to explore the effect of allocating financial resources to human development versus economic development. To this end, it is assumed that:
Priority given to Human Development = 1 - Priority given to Economic Development
In other words, the fraction allocated to human development and the fraction allocated to economic development must add up to 1. Thus the range of the priority given to human development is 0 to 1. Selecting 1 means that 100% of capital investment is allocated to social and human development. Selecting 0 means that 100% of capital investment is allocated to economic growth and pollution mitigation. Selecting 0.5 means that 50% goes to economic growth and 50% goes to social/human development. The default value is 0.25.
2. INTENDED HUMAN BIRTH RATE
The range of allowable values for intended human birth rate is 0.03 to 0.09. The default value is 0.065. This translates (after some crude demographic calculations) to approximately 1.18% growth per year (the average growth per year from 2001 to 2009) assuming an average life expectancy is 50 years. Starting with 2.5 billion as of 1950, setting the intended human birth rate at 0.065 calibrates the total human population to reach 6.8 billion by 2010.
|
5. SDSIM Version 1.2 Mathematical Formulation
|
The SDSIM digital simulation model is formulated as a set of recursive first- and zero-order difference equations. The first-order equations are levels (integrals, i.e., accumulations, stocks) and the zero-order (algebraic) equations are the flows (or rates of change of the levels. There are ten level equations:
HUMAN POPULATION (persons)
HUMAN CONSUMPTION (real value dollars)
ENERGY CONSUMPTION (million tons of oil equivalent - MTOE)
CUMULATIVE POLLUTION (parts per million by volume - PPMV)
BIOSPHERE INTEGRITY (percentage of pristine biomass/biodiversity)
CLIMATE INTEGRITY (percentage of pristine stabilizing capacity)
ECOLOGICAL CAPITAL (percentage of pristine ecosystem services)
FINANCIAL CAPITAL (total dollars - both phantom wealth and real wealth)
SOCIAL CAPITAL (percentage of the population that practice solidarity/gender equality)
HUMAN CAPITAL (percentage of the population in the 4th and 5th Maslow levels)
Mathematically, the level equations are of the form
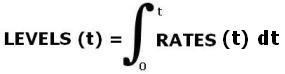
or, in difference equation notation,
LEVEL(t) = LEVEL(t-dt)+dt*[input rate(t) - output rate(t)]
and the rate equations are of the form

or, in algebraic notation,
RATE(t) = f [constants and functions of LEVELS(t)]
|
SDSIM 1.2 LIST OF MODEL EQUATIONS IN STELLA NOTATION
The equations in STELLA notation are listed in the order of execution for each iteration, i.e., 1950, 1951,
. , 2199, 2200. For each variable and constant, the name is shown first followed by the initial values for levels and the constant values for conversion factors. Then the units are shown, followed by a brief description of the variable or constant. Initialization equations are listed first. Then the runtime equations are listed, first the levels, then the rates. Note that there may be several equations that pertain to the formulation of a rate. The equations with pairs of numerical values are nonlinear graphic functions, with the independent variable shown in parenthesis on the right-hand side of the equation and the dependent variable on the left-hand side of the equation. Finally, the time specifications are listed, i.e., start time = 1950, stop time = 2200, and delta time = 1.0. Euler's method (rectangular integration) is used. The run mode is set to normal (i.e., all flows are continuous without identification of batches or cycle times of specific items) and the pause interval is set to infinity (i.e., the simulation rums without pause from start time to stop time.
To view the list of equations in STELLA notation, click HERE
|
|
6. SDSIM Version 1.2 User Interface
|
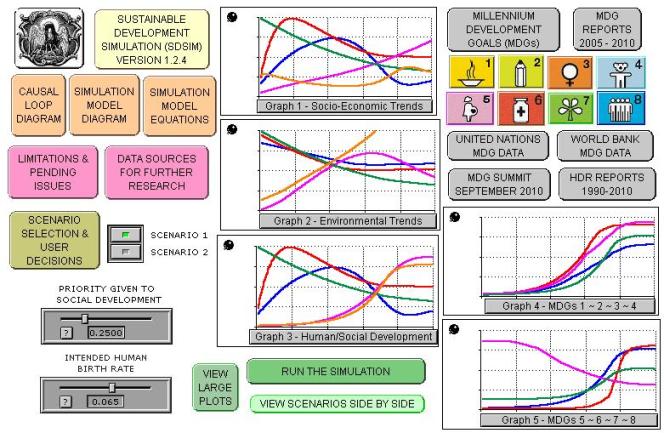
GUIDE TO SDSIM USER INTERFACE
It is hoped that this simulation model will be useful for the analysis of trade-offs between social development and economic development priorities.
The user can click on the following boxes to bring up supporting text:
THE PELICAN WEB & JOURNAL LOGO - Click on this box to navigate to the Pelican Web Home Page
SUSTAINABLE DEVELOPMENT SIMULATION (SDSIM) - A brief overview of the model scope and objectives
CAUSAL LOOP DIAGRAM - Link to the causal loop diagram
SIMULATION MODEL DIAGRAM - Link to the STELLA simulation model diagram
SIMULATION MODEL EQUATIONS - Link to the simulation model equations in STELLA notation
LIMITATION & PENDING ISSUES - Link to a detailed list of current model limitations and pending issues
DATA SOURCES FOR FURTHER RESEARCH - Links to Touchgraphs that identify information and data sources for each of the model sectors and the MDGs
SELECTION SCENARIO & USER DECISIONS - Definitions of the two scenarios that can be selected and the two decision variables currently available for experimentation by users
SCENARIO SELECTION - Click on the switch for scenario 1 or scenario 2 (the green light shows which scenario you are running)
DECISION VARIABLES - Move the slider for "priority given to social development" and/or "intended human birth rate." Click on the "?" to view the definition of each decision variable. If you move either slider, click on the "U" to return to the default value.
RUN THE SIMULATION - Click on this box to run the simulation (1950-2200)
VIEW LARGE PLOTS - Link to a web page that provides large images of the simulation plots, with identification for each trend and numerical values
VIEW SCENARIOS SIDE BY SIDE - Link to a table of graphs with scenarios 1 and 2 shown side by side
GRAPH 1 - Definitions of the socio-economic variables plotted in Graph 1 and brief overview of their dynamic behavior
GRAPH 2 - Definitions of the environmental variables plotted in Graph 2 and brief overview of their dynamic behavior
GRAPH 3 - Definitions of the human/social development variables plotted in Graph 3 and brief overview of their dynamic behavior
GRAPH 4 - Definitions of the MDGs (1-2-3-4) plotted in Graph 4 and brief overview of their dynamic behavior
GRAPH 5 - Definitions of the MDGs (5-6-7-8) plotted in Graph 5 and brief overview of their dynamic behavior
MILLENNIUM DEVELOPMENT GOALS - Link to the UN Millennium Development Goals web site
MDG REPORTS 2005-2010 - Link to the library of MDG Annual Reports, 2005 to 2010
MDG 1, MDG2, MDG3, MDG4, MDG5, MDG6, MDG7, MDG8 - Links to the MDG 1, 2, 3, 4, 5, 6, 7, 8 web sites (these web sites provide lists of targets and indicators for each MDG)
UNITED NATIONS MDG DATA - Link to the United Nations database on MDG trends
WORLD BANK MDG DATA - Link to the World Bank database on MDG trends
MDG SUMMIT SEPTEMBER 2010 - Link to documentation of the MDG Review Summit (September 2010)
HDR REPORTS 1990-2010 - Link to the library of Human Development Reports, 1990 to 2010
Section 9 provides links to Touchgraph maps of information/knowledge pertaining to each one of the ten nodes (level variables) of the simulation model: human population, human consumption, energy consumption, cumulative pollution, biosphere integrity, climate integrity, ecological capital, financial capital, social capital, and human capital. TouchGraph links for each of the MDGs are also provided. These are included to facilitate searching for information pursuant to critical reviews of the model.
At the moment, the user can change one or both of two decision variables:
- PRIORITY GIVEN TO SOCIAL/HUMAN DEVELOPMENT
- INTENDED HUMAN BIRTH RATE
The best way to start is to read the supporting text for all the boxes and, in particular, the USER DECISIONS box. Then run the model initially with the default settings. Click on the "?" in the sliders to see the precise definition of the decision variable. Then the user can change one or both of the two decision variables. It is suggested that the user try small changes for each variable first, then run simulations at the extreme values for each variable. After making changes, click on the "u" to reset the decision variables to their default values.
NOTE: Any suggestion for improving the definition of modeling requirements, the model design and formulation, the user interface, and the analysis and synthesis of the simulation results would be most welcome. To submit comments/suggestions/corrections please contact the journal editor.
|
FREE DOWNLOAD: To download the SDSIM 1.2 model, click on the button to the right. SDSIM requires STELLA 9.1.3 or higher. Readers who do not have the STELLA software can download a free one month trial from ISEE Systems.
|
|
Image of the SDSIM Version 1.2 User Interface
To access the operational web-based user interface for SDSIM Version 1.2, click
here
The user interface currently allows selection of scenarios 1 or 2
and manipulation of two decision variables:
PRIORITY GIVEN TO SOCIAL/HUMAN DEVELOPMENT and INTENDED HUMAN BIRTH RATE
The user interface is currently hosted by the Forio Simulations web site.
|

|
To run SDSIM 1.2 SCENARIOS 1 or 2, click
HERE
|
|
|
7. SDSIM Version 1.2 Simulation Results
|
|
The Sustainable Development Simulation (SDSIM) model takes into account demographic, economic, social, financial, and ecological factors. It includes both material flows and human decisions on the allocation of resources to economic growth versus social/human capital.
SDSIM is intended to be used in a "backcasting" mode. In other words, SDSIM Is not about predicting the future. It is about defining what kind of future we want, and then working backwards to see what kinds of human decisions and behavior are required in order to bring about the kind of world we want to have. The simulation graphs inserted below have three phases:
1950-2010: This is the past, so there is nothing we can do about it.
2100-2200: This is the future we want to ensure in order to attain a healthy balance between humanity and the human habitat.
2010-2100: This is the window of opportunity. Both social and ecological time constants are very long, and the explosive growth of the second half of the 20th century, driven by a Wall Street economy, will have repercussions during the 21st and 22nd centuries and beyond. If we want to attain a transition from a Wall Street to a Main Street economy, and a semblance of harmony between humanity and the human habitat, the years from 2010 to 2100 is the time to accomplish the transitions from patriarchy to solidarity, consumerism to sustainability, and imperialism to subsidiarity.
The five plots shown below for scenarios 1 and 2 come from the same simulation model:
- Transition dynamics of human population, human consumption, energy consumption, consumption per capita, and ecological capital (economic development focus)
- Transition dynamics of cumulative pollution, biosphere integrity, climate integrity, ecological capital, and financial capital (environmental management focus)
- Transition dynamics of human population, human consumption, human capital, social capital, and ecological capital (social/human development focus)
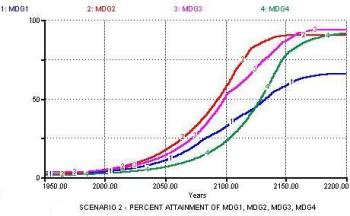
- Transition dynamics leading to measurable progress toward attaining MDG 1, 2, 3, and 4
- Transition dynamics leading to measurable progress toward attaining MDG 5, 6, 7, and 8
Version 1.2 Scenario 1 results are the same that were reported for Version 1.0. Version 1.2 Scenario 2 results are significantly different due to the additional feedback loops coupling human development to the environmental sector. The main differences are:
- Significant mitigation of population decline from 2050 to 2150 (graphs S1G1 vs S2G1)
- Significant mitigation of environmental deterioration from 2010 to 2200 (graphs S1G2 vs S2G2
- Additional accumulation of social/human capital from 2015 to 2200 (graphs S1G3 vs S2G3
In brief: population decrease slows down, environmental deterioration slows down, and growth in social/human is reinforced. However, these gains are based on modeling assumptions that require validation:
- It is assumed that economic and conservation activities can proceed unperturbed by exponential growth in the mix of real and speculative (toxic) financial assets.
- It is assumed that the market takes care of inducing gradual substitution of dirty energy sources by clean energy sources, and that the supply of energy to the economy is unperturbed no matter how much energy it requires.
- It is assumed that population and environmental management are improved by improving human capital, but other interactions between human capital and social capital with each other and with the economic and environmental sectors are not explicitly taken into account.
The following table shows the simulation results with scenarios 1 and 2 side by side. Graphs 1, 2, and 3 for Version 1.2 are identical to those shown before for Version 1.1, since the core model has not changed. Graphs 4 and 5 for Version 1.2 show the results of extending the core model to calculate the percent attainment of the MDGs as a function of human, social, and ecololical capita.
|

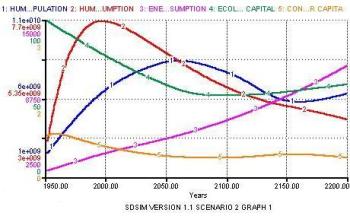
S1G1. Rapid population decrease from 2050 to 2150, followed by severe oscillations in population levels and consumption per capita.
|
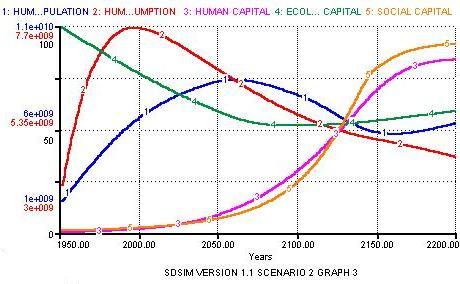
S2G1. Mitigated population decrease from 2050 to 2150, followed by moderate demographic and consumption oscillations.
|

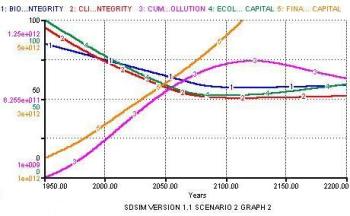
S1G2. Rapid environmental deterioration from 2000 to 2200, with trends indicative of irreversible damage and climate integrity on a nose dive.
|
S2G2. Moderate environmental deterioration from 2000 to 2100, followed by stabilization/recovery of both the biosphere and climate.
|
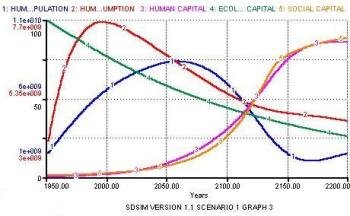
S1G3. Human capital and social capital grow from 2050 to 2200, but with significant demographic and environmental impacts.
|
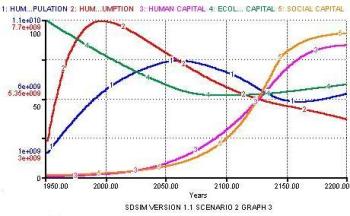
S2G3. Human capital and social capital grow from 2050 to 2200, with moderate demographic and environmental impacts.
|
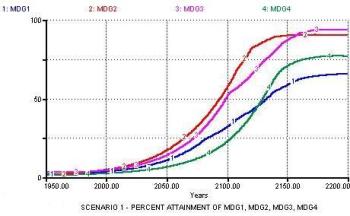
S1G4. Human capital and social capital grow from 2050 to 2200, followed by progress toward percent attainment of the MDGs after 2100.
|
S2G4. Human capital and social capital grow from 2050 to 2200, followed by progress toward percent attainment of the MDGs after 2100.
|
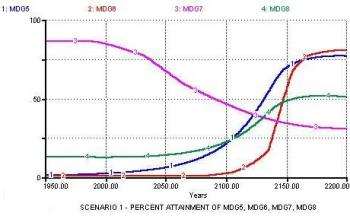
S1G5. Human capital and social capital grow from 2050 to 2200, followed by progress toward percent attainment of the MDGs after 2100.
|

S2G5. Human capital and social capital grow from 2050 to 2200, followed by progress toward percent attainment of the MDGs after 2100.
|
|
Below is a summary of behavior modes for each graph of scenarios 1 and 2:
SDSIM V1.2 Simulation Results - Scenario 1 - Graph 1
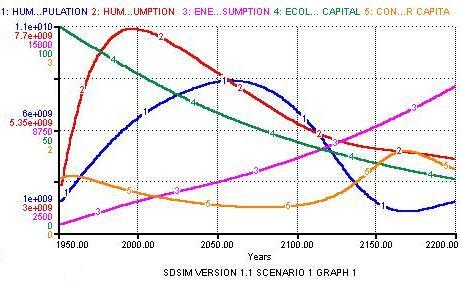
Human Population & Economic Development Perspective
Shows the transition dynamics of
HUMAN POPULATION (BLUE), HUMAN CONSUMPTION (RED),
ENERGY CONSUMPTION (PINK), ECOLOGICAL CAPITAL (GREEN),
and CONSUMPTION PER CAPITA (YELLOW)
To view an LARGER image of the simulation plot, click HERE
SDSIM V1.2 Simulation Results - Scenario 1 - Graph 2
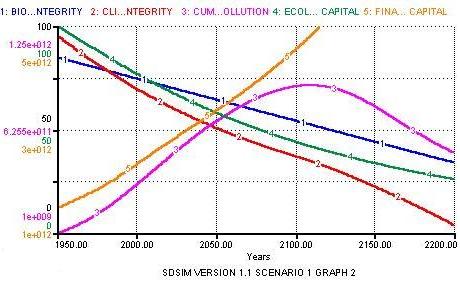
Ecology, Pollution, and Environmental Management Perspective
Shows the transition dynamics of
BIOSPHERE INTEGRITY (BLUE), CLIMATE INTEGRITY (RED),
CUMULATIVE POLLUTION (PINK), ECOLOGICAL CAPITAL (GREEN),
and FINANCIAL CAPITAL (YELLOW)
To view an LARGER image of the simulation plot, click HERE
SDSIM V1.2 Simulation Results - Scenario 1 - Graph 3
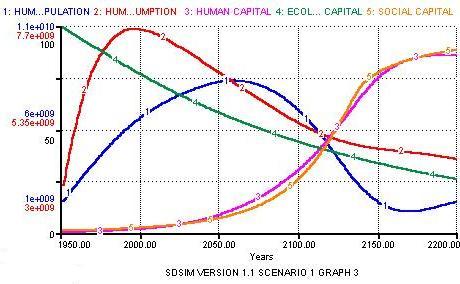
Economic Development versus Social/Human Development Perspective
Shows the transition dynamics of
HUMAN POPULATION (BLUE), HUMAN CONSUMPTION (RED),
HUMAN CAPITAL (PINK), ECOLOGICAL CAPITAL (GREEN),
and SOCIAL CAPITAL (YELLOW)
To view an LARGER image of the simulation plot, click HERE
SDSIM V1.2 Simulation Results - Scenario 1 - Graph 4
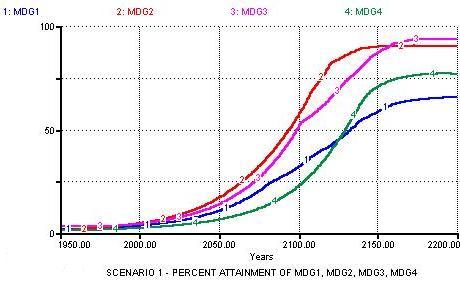
Global Sustainable Development and Attainment of MDGs 1-2-3-4
Shows the transition dynamics of
MDG1 (BLUE), MDG2 (RED), MDG3 (PINK), and MDG4 (GREEN)
To view an LARGER image of the simulation plot, click HERE
SDSIM V1.2 Simulation Results - Scenario 1 - Graph 5
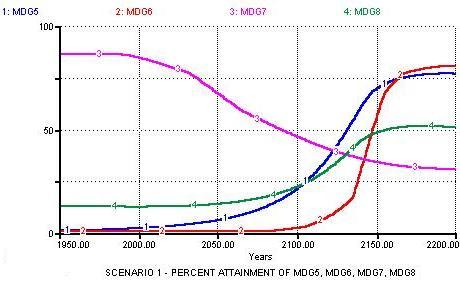
Global Sustainable Development and Attainment of MDGs 5-6-7-8
Shows the transition dynamics of
MDG5 (BLUE), MDG6 (RED), MDG7 (PINK), and MDG8 (GREEN)
To view an LARGER image of the simulation plot, click HERE
SDSIM V1.2 Simulation Results - Scenario 2 - Graph 1

Human Population & Economic Development Perspective
Shows the transition dynamics of
HUMAN POPULATION (BLUE), HUMAN CONSUMPTION (RED),
ENERGY CONSUMPTION (PINK), ECOLOGICAL CAPITAL (GREEN),
and CONSUMPTION PER CAPITA (YELLOW)
To view an LARGER image of the simulation plot, click HERE
SDSIM V1.2 Simulation Results - Scenario 2 - Graph 2

Ecology, Pollution, and Environmental Management Perspective
Shows the transition dynamics of
BIOSPHERE INTEGRITY (BLUE), CLIMATE INTEGRITY (RED),
CUMULATIVE POLLUTION (PINK), ECOLOGICAL CAPITAL (GREEN),
and FINANCIAL CAPITAL (YELLOW)
To view an LARGER image of the simulation plot, click HERE
SDSIM V1.2 Simulation Results - Scenario 2 - Graph 3
Economic Development versus Social/Human Development Perspective
Shows the transition dynamics of
HUMAN POPULATION (BLUE), HUMAN CONSUMPTION (RED),
HUMAN CAPITAL (PINK), ECOLOGICAL CAPITAL (GREEN),
and SOCIAL CAPITAL (YELLOW)
To view an LARGER image of the simulation plot, click HERE
SDSIM V1.2 Simulation Results - Scenario 2 - Graph 4

Global Sustainable Development and Attainment of MDGs 1-2-3-4
Shows the transition dynamics of
MDG1 (BLUE), MDG2 (RED), MDG3 (PINK), and MDG4 (GREEN)
To view an LARGER image of the simulation plot, click HERE
SDSIM V1.2 Simulation Results - Scenario 2 - Graph 5
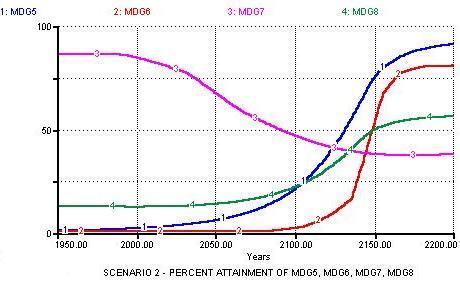
Global Sustainable Development and Attainment of MDGs 5-6-7-8
Shows the transition dynamics of
MDG5 (BLUE), MDG6 (RED), MDG7 (PINK), and MDG8 (GREEN)
To view an LARGER image of the simulation plot, click HERE
In brief, the simulations reflect the well known fact that there are limits to material economic growth. Technological advances might allow for adjusting the limits, but the fact remains that it is impossible to have unlimited material growth in a limited planet. Energy consumption appears to grow without limits by assuming that conversion from fossil fuels to clean sources of energy. If solar energy is included in the energy mix, then for all practical purposes energy consumption becomes unlimited relative to materials consumption that are constrained by recycling times. Financial capital also can grow indefinitely as long as it includes both phantom wealth and real wealth. Wall Street banks can create as much phantom wealth as they want by simply creating money via accounting entries, and the possibility of paper becoming limiting for printing the money does not seem to be an issue at the moment -- if the world has to go paperless, they can keep generating money electronically. Finally, the simulations suggest that it might take a century to increase social and human capital to the point in which a large percentage (say, 80% or more) of the human population has reached the upper levels of Maslow's human development hierarchy. In the long term, accumulation of human/social capital then leads to adaptation pursuant to harmony between human population and the human habitat. However, the simulations suggest that progress toward attaining the MDGs is contingent on the accumulation of human and social capital, and the stabilization of ecological capital, during the 21st century. After a time lag (neither mitigation nor adaptation happen instantaneously), progress toward attaining the MDGs becomes measurable in the 22nd century.
NB: There is no way in the world that the current
MDG targets can be reached by 2015.
|
|
8. Comparative Analysis & Synthesis
|
|
ANALYSIS
Analysis of the simulations entails explaining the simulated behavior by reference to the feedback loop structure of the system. At a high level, all the "gibberish" in the STELLA flow diagram (Section 4) can be avoided by referring back to the causal loop diagram (Section 2).
The causal loop diagram is reproduced below, with some loops shaded to facilitate the narrative. Basically, the outermost sets of loops are inactive as long as ecological capital is high, but become limiting when ecological capital depletes to a low level. This might seem obvious, but Dennis and Donella Meadows deserve much credit for bringing this reality to the attention of all global citizens with their initial (1972) publication of The Limits to Growth.
Most of the inner loops remain dormant during the simulation. Specifically, the loop between financial capital and ecological capital is practically dead. This is so because the model does not distinguish between reversible and irreversible ecological capital depletion. Actually, in the current system, ecological capital depletion is treated as an "externality" that is irrelevant to the financial sector. As long as this is the way the real financial system works, there is no modeling incentive to dig deeper in this area. However, if financial reform eliminates the "externalities" trick, then it would be worthwhile to investigate the extent to which ecological capital depletion can be reversed by investing in appropriate ecosystem recovery technologies.
The loop shaded in blue is the basic economic growth engine. In a consumerist culture, this positive feedback loop would grow exponentially until constrained by the collateral damage caused by toxic pollution and the depletion of ecosystem services by the unregulated usage of natural resources, both renewable and non-renewable. But note that the orange loop is embedded within a larger orange/brown loop that couples the economic system with the social and political systems. At this point in human history, there is no "political will" to moderate consumerist priorities in order to focus on what really matters: social and human development. Therefore, the brown side of the orange/brown loop is very weak and, as long as this remains so, GDP will continue to increase, the rich-poor gap will continue to widen ("big fish eats small fish"), and very few people will develop their full human potential (human capital) to the point of demanding politicians to free themselves from the Wall Street economy in order to embrace the Main Street economy.
SDSIM Version 1.2 - Visualization of the Simulation Analysis and Synthesis
NB: The causal loop diagrams for SDSIM 1.1 and 1.2 are the same.
ANALYSIS
In Version 1.2 Scenario 1, the loops shaded in blue are dominant, as in Version 1.0.
In Version 1.2 Scenario 2, the loops shaded in orange mitigate environmental deterioration.
The loops shaded in yellow reinforce social/human development even more than in Version 1.0,
and serve as balancing arbiter between the blue-shaded and orange-shaded loops.
SYNTHESIS
The transition from consumerism to sustainability requires
a shift in dominance from the blue-shaded loops to the
the orange-shaded mitigation loops and the
yellow-shaded adaptation loops.
A RADICAL SHIFT IN LOOP DOMINANCE AS DESCRIBED ABOVE
MIGHT MAKE THE TRANSITION SMOOTHER AND SHORTEN
THE TIME LAG TO ATTAIN THE MDG TARGETS
SYNTHESIS
The transition from consumerism to sustainability requires a shift in dominance from the blue-shaded loops to the orange-shaded and yellow-shaded loops. How could this shift be accomplished? Mitigation of population growth is necessary, but not sufficient; for "the bed is the consolation of the poor" and the poor - those who are barely surviving in the bottom level of Maslow's pyramid - cannot be expected to reduce birth rates by either natural or artificial means. Somehow, economic incentives will have to be reformed so that education of the poor, and social/human development initiatives, become as profitable as making and selling widgets to those who can pay for them.
In the context of SDSIM, this will require deeper analysis of the orange-shaded and yellow-shaded loops in order to elucidate how peoples and governments might steer the economic system so that it becomes economically profitable, socio-politically viable, and ecologically sustainable. This is "where the rubber meets the road." Human development (coupled with social development) must keep the orange-shaded and yellow-shaded loops in balance with each other and dominant over the blue-shaded loop. Human development (coupled with social development) is the only solution to the sustainable development paradox.
|
|
9. Limitations & Pending Issues
|
|
SDSIM Version 1.2 is a prototype for SDSIM. In other words, it is a test model. It could be used as a teaching tool or as focal point for discussion. But a significant amount of model verification and validation work will be required before it is ready for decision-making support of policy support. It is presently offered version for review and evaluation by the community of world system thinkers and scholars. In order to facilitate searching for information/knowledge pursuant to providing feedback, the following is a list of links to TouchGraphs of web content related to each of the ten nodes and the eight MDGs in the current model:
Each TouchGraph has a search box to get a revised list and map of web sites containing relevant content. For instance, "human development" might be used instead of "human capital," or "biomass biodiversity" might be used instead of "biosphere integrity." Lists of pending issues and planned enhancements are provided below.
The following is a list of pending issues:
- Is "what are the priorities for human development versus economic development" the right question to ask?
- Is "what are the priorities for mitigation versus adaptation strategies another important question to consider?
- Are there other important questions that should be considered for Versions 2+?
- The modeling context is a mix of data-rich and data-poor situations. There is abundant data for the economic and ecological sectors, but there is a paucity of data for the social and human capital sectors (e.g., "political will").
- The model is primarily intended for "qualitative" analysis rather than "quantitative" forecasting. Need to make this clear.
- Only the human population curve is calibrated to real world data (1950-2010). Need data for initial conditions in the other material levels
- Need to articulate a meaningful interpretation of numerical values in the percentage levels (biosphere integrity, climate integrity, ecological integrity, social capital, human capital).
- Need to articulate how is the model to be used in a "backcasting" mode during the period 2010-2100. There must be switches that trigger policy changes at time = 2010, 2020, 2030, 2040, 2050, ....
- Use of Maslow's hierarchy of needs as the basis for interpretation of human capital.
- Use of gender equality indices (and other indices of social cohesion) as the basis for interpretation of social capital.
- Clear differentiation between real financial capital (real wealth) and volatile financial capital (phantom wealth).
- What version of "US Dollars" should be used for human consumption?
- What version of "US Dollars" should be used for financial capital?
- How to find a significant sample of interested/competent reviewers? Options include the pelicanweb subscribers, forums such as "World Systems Thinking," online surveys (effectiveness?)
The following is a list of planned refinements and extensions:
- Verification and validation of SDSIM objective(s)
- Verification and validation of the SDSIM user interface
- Verification and validation of SDSIM initial conditions as of 1950, simulated values as of 2010.
- Verification and validation of the SDSIM causal loop diagram(s)
- Take into account the interactions between the socioeconomic and financial sectors
- Elucidate the transition from non-renewable to renewable energy sources
- Clarify the interaction between human development and social development proceses
- Verification and validation of the SDSIM STELLA diagram(s)
- Take into account the interactions between the socioeconomic and financial sectors
- Elucidate the transition from non-renewable to renewable energy sources
- Clarify the interaction between human development and social development proceses
- Verification and validation of the SDSIM STELLA equations, conversion factors, and nonlinear functions
- Take into account the interactions between the socioeconomic and financial sectors
- Elucidate the transition from non-renewable to renewable energy sources
- Clarify the interaction between human development and social development proceses
- Verification and validation of the SDSIM simulated behavior modes
- Can unregulated real/phantom financial instruments proliferate without bounds?
- Can the free market manage the transition from non-renewable to renewable energy sources
- Under what conditions are human development and social development mutually reinforcing?
- Verification and validation of the SDSIM simulation analysis and synthesis
- Impact of financial growth/speculation on real wealth
- Social, economic, and environmental impacts of energy source substitution
- Mutually reinforcing effect of human development and social development
- Identification of potential users (decision makers, policy makers) via expressions of interest
- Identification of institutional reformations required during the transition from consumerism to sustainability
- Definition of module interfaces for the fractal world-nations-localities structure (nesting hierarchy)
- Analysis and synthesis of feedback from reviewers and potentially interested users, specially with regard to changes in human behavior modes and human decision-making patterns at successively higher levels of human well-being.
|
|Back to the SUMMARY|
|Back to SECTION 1|
|Back to SECTION 2|
|Back to SECTION 3|
|Back to SECTION 4|
|Back to SECTION 5|
|Back to SECTION 6|
|Back to SECTION 7|
|Back to SECTION 8|
|Back to SECTION 9|
Page 1
Page 2
Page 3
Page 4
Page 5
Page 6
Page 7
Page 8
Page 9
Supplement 1
Supplement 2
Supplement 3
PelicanWeb Home Page
|
|
"True knowledge exists in knowing
that you know nothing."
Socrates (469 - 399 BCE)
|
|
Supplement 3
|
|
FREE SUBSCRIPTION
|
![[groups_small]](groups_small.gif)
|
Subscribe to the
PelicanWeb's Journal of
Sustainable Development
via the Solidarity-Sustainability Group
Enter your email address:
|
|
|
|
